Documentation >
How-To Guide for GigaFlowSee also System > GigaFlow Cluster.
Overview
A single GigaFlow server can be configured to search for IP addresses across many remote GigaFlow servers directly from Viavi's Apex system. This feature is useful for large organisations that may have many GigaFlow servers monitoring different networks within the organisation, e.g. in different regions. The central administrator may want a view across the entire network, e.g. to determine if a particular suspect IP address has been recorded by routers on different networks.
In this example, assume that you, as the main administrator, want visibility on several remote GigaFlow servers.
The set-up is:
- GigaFlow Server #0: this is the server at HQ, used by the main administrator. We call this the Pitcher.
- GigaFlow Server #1: this is remote GigaFlow server #1. We call this Receiver 1.
- GigaFlow Server #2: this is remote GigaFlow server #2. We call this Receiver 2.
- GigaFlow Server #3: this is remote GigaFlow server #3. We call this Receiver 3.
Figure: Defining a GigaFlow cluster
Configure the Cluster
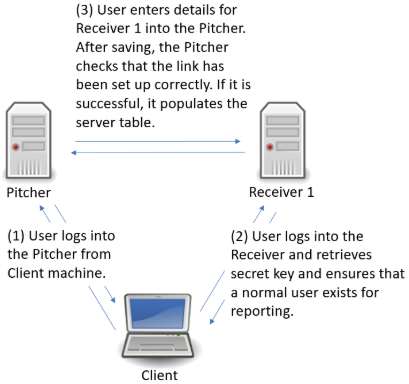
Log in to GigaFlow Server #0, the Pitcher, and navigate to System > GigaFlow Cluster.
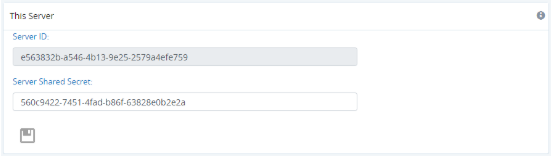
In the This Server panel, you will see a pre-generated unique secret. Leave this as is.
In another browser tab or window, log into Receiver 1 (GigaFlow Server #1). Copy the unique secret from Receiver 1's This Server panel. You do not need to do anything with the New Cluster Server panel on the receivers.
Figure: This Server panel
Switch back to the Pitcher (GigaFlow Server #0). In the New Cluster Server panel:
- Enter a name that you will see during a search across servers, i.e. Receiver 1.
- Enter the description that you will see when hovering-over the server name during a search across servers, e.g. "EMEA GigaFlow server (Receiver 1)".
- Enter the full URL, including port number, used to connect to Receiver 1, i.e. in the format "http(s)://172.1.1.0:22".
- Enter the IP address of the Pitcher system as seen by Receiver 1. This IP address is used by the Pitcher to generate a secure hashed key for communication. The Receiver reverses this hash using, among other things, the IP address of the Pitcher. An intermediate firewall (NAT) could create problems if the Pitcher does not create the hashed key using the IP address seen by the Receiver.
- Enter the UserID used when making superuser calls to Receiver 1, e.g. Admin. This is used during this set-up process.
- Enter the UserID that will be used when making report requests, e.g. reportuser; this is used by all clients when collecting data from the Receiver. This user must exist on Receiver 1. If it does not exist, switch to Receiver 1 and create a new normal user on Receiver 1, i.e. reportuser.
- Paste Receiver 1's secret, i.e. the key copied from Receiver 1's This Server panel.
- Click Save <img src = "./assets/images/save_icon.png" alt = "Save icon." width = "14px" height = "14px"> to add the Receiver 1.
- The Pitcher will connect to Receiver 1 using the Admin user to verify that everything is correct and to populate the table at bottom of the System page. Receiver 1 will appear in the main table.
Figure: New Cluster Server panel

Repeat this process for Receiver 2 and Receiver 3.
The cluster server feature is flexible; a receiver in one cluster can be a pitcher for another.
Search the GigaFlow Cluster
Figure: Conducting a GigaFlow Cluster search
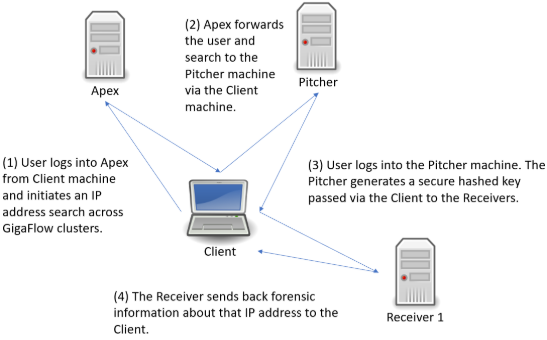
Following the search link from Apex, you will be brought to a new tab and the log in screen for the Pitcher machine. After logging in, you will be brought to the GigaFlow Cluster report page.
Figure: The initial view of the GigaFlow Cluster report page

This displays a list of hits for this IP address across the cluster; in this example, the IP address 172.21.21.21 was found on 11 devices monitored by three receivers. On these receivers the system found 9 devices with data matching the search and there were no errors.
In the first first table, each GigaFlow server is listed with:
- Server name.
- The URL to connect to the server; follow this link to access the full UI for that particular server.
- The type of result; in this case flows.
- Which device monitored by this server had the data.
- Device details: name, interface and the number of flows seen.
- A number and visualization of the data size; this is a ranking of result relevance.
- A drill-down link to forensics data for each result. A full view into the receiver is displayed below the top table; this allows you to view the results and interact with that GigaFlow server without having to leave this page.
Figure: Clicking on the drill down icon beside a result brings up the full user interface and a forensics report for that device on the associated GigaFlow server

The system allows ten minutes between running the report and viewing these results without re-authentication.
You can also select different report types to run on that device on that GigaFlow server by selecting from the drop-down menu. See Reports > Forensics in the main Reference Manual for more.
Encryption and GigaFlow Clusters
Communication between all clients in a Gigaflow cluster is IP to IP, i.e. unicast. The traffic is routed over https, using TLS based on certificates.