Documentation >
Reference Manual for GigaFlow >
DashboardsAfter logging in, you will see the Server Overview Dashboard. From here you have direct access to some of GigaFlow's main functions.
Figure: GigaFlow's main dashboard

Located at Dashboards > Performance Overview.
This is a summary of traffic across the busiest infrastructure devices over the past hour. Infrastructure devices are routers sending flow as well as other Layer-2 devices that are not sending flow but sending ARP and CAM Tables. The information displayed includes:
- Avg Bits/s: average traffic per second per device.
- Percentage: this is the proportion of all traffic over the past hour seen by a particular system/router.
- Position relative to the same hour last week: this is the percentage increase or decrease in traffic per second per device compared with the same hour last week.
When more than ten devices are registered, the full list can be displayed by clicking the drill down icon. This displays a tabular version of all the data, with a CSV export option.
This is a summary of traffic across the busiest interfaces over the past hour. The information displayed includes:
- Avg Bits/s: average traffic per second.
- Max: this is maximum traffic volume seen in the data set.
- Percentage: this is the proportion of all traffic seen by a particular interface.
- Position relative to the same hour last week: this is the percentage increase or decrease in traffic per second per interface compared with the same hour last week.
When more than ten interfaces are registered, the full list can be displayed by clicking the drill down icon. This displays a tabular version of all the data, with a CSV export option.
See Configuration > Infrastructure Devices for setup instructions.
This graph shows the traffic associated with the busiest traffic groups over the past hour. The information displayed includes:
- Avg Bits/s: average traffic per second per traffic group.
- Percentage: this is the proportion of all traffic over the past hour seen by a particular traffic group.
- Position relative to the same hour last week: this is the percentage increase or decrease in traffic per second per traffic group compared with the same hour last week.
When more than ten traffic groups are registered, the full list can be displayed by clicking the drill down icon. This displays a tabular version of all the data, with a CSV export option.
This graph shows the traffic associated with the busiest applications over the past hour. The information displayed includes:
- Avg Bits/s: average traffic per second per application.
- Percentage: this is the proportion of all traffic over the past hour seen by a particular application.
- Position relative to the same hour last week: this is the percentage increase or decrease in traffic per second per application compared with the same hour last week.
When more than ten applications are registered, the full list can be displayed by clicking the drill down icon. This displays a tabular version of all the data, with a CSV export option.
This graph shows the traffic associated with the busiest source IPs in the past hour. The information displayed includes:
- Avg Bits/s: average traffic per second per source IP.
- Percentage: this is the proportion of all traffic over the past hour seen by a particular source IP.
- Position relative to the same hour last week: this is the percentage increase or decrease in traffic per second per source IP compared with the same hour last week.
When more than 10 IP addresses are registered, the full list can be displayed by clicking the drill down icon. This displays a tabular version of all the data, with a CSV export option.
This graph shows the traffic associated with the busiest destination IPs in the past hour. The information displayed includes:
- Avg Bits/s: average traffic per second per source IP.
- Percentage: this is the proportion of all traffic over the past hour seen by a particular destination IP.
- Position relative to the same hour last week: this is the percentage increase or decrease in traffic per second per destination IP compared with the same hour last week.
When more than 10 IP addresses are registered, the full list can be displayed by clicking the drill down icon. This displays a tabular version of all the data, with a CSV export option.
Located at Dashboards > Server Overview.
Figure: Detail of the left main menu and Dashboards submenu.
This default welcome screen shows summary server flow information with three main sections:
This is a summary of traffic across all of your infrastructure devices ranked by the busiest network device. Infrastructure devices are routers sending flow as well as other Layer-2 devices that are not sending flow but sending ARP and CAM Tables. The information displayed includes:
- Avg Bits/s: average traffic per second.
- Max: this is maximum traffic volume seen in the data set.
- Percentage: this is the proportion of all traffic seen by particular system/router.
The bars on the graph indicate the volume of data seen over the reporting period, by default 2 hours.
This is a graph and table of interface bit rates, with a breakdown by individual interface. This is a summary of the busiest interfaces across your network.
See Configuration > Infrastructure Devices for setup instructions.
When more than 10 devices are registered, the full list can be displayed by clicking List All Drill down icon. beside the table title.
The CSV link at the top right of the table generates a .csv export.
This middle graph shows all events and alerts across your network during the reporting period.
Figure: Detail of GigaFlow's report period selection panel, at the top of most pages
- The reporting period is shown at the top right of the main body of the page. This is 2 hours by default.
- On login, the system displays information for the default time period.
- This default time period can be set in Configuration > Reporting in the main menu.
- Different reporting periods can be selected by clicking the from and to boxes.
Figure: Clicking in either the From or To field brings up a date and time selector.

Click once on any infrastructure device IP address or interface in the tables and you will be taken to an overview report for that device or interface. You can access the same overview using GigaFlow's search function. Search for the IP address and in the main left-hand side table, click the Infrastructure Device name. In the right-hand side table, click Overview.
See Dashboards > Device Overview and Dashboards > Interface Overview.
Located at Dashboards > Device Overview; there is also a unique Device Overview subpage for each infrastructure device.
From the Dashboards menu, the Device Overview option displays:
- Busiest devices in the past hour.
- Summary devices.
This information is also displayed in Performance Overview and in Server Overview. See Dashboards > Performance Overview > Top Devices (Last Hour v Last Week Hour) and Dashboards > Server Overview.
Device Overview Subpages
Click once on any infrastructure device IP address or interface in the tables and you will be taken to an overview report for that device or interface. You can access the same overview using GigaFlow's search function. Search for the IP address and in the main left-hand side table, click the Infrastructure Device name. In the right-hand side table, click Overview.
The overview for each infrastructure device includes graphs and tables with useful information. These include:
This panel lists the most important device information, including:
- IP address.
- Display name.
- SysName.
- SysLocation.
- SNMP status.
- ARP entries.
- CAM entries.
- System description.
You can add an Attribute, or alias, for network infrastructure by selecting from the interface Attributes drop down selector. See Configuration > Attributes for more on attributes. This panel lists attributes and useful tools associated with the selected device, including:
Attributes. See Configuration > Infrastructure Devices and click on any device for more.Links out to useful tools, including Forensics, ARPs, CAMs, Live Interfaces and Traffic Overview.Links to associated integrations. See System > Global for more about integrations.
Figure: Visual from Device Overview subpage

The information is presented as a pie-chart. Each application can be queried by clicking the drill down icon for more.
This graph shows the top 10 ports/applications associated with this device in the past hour.
This graph shows the top 10 traffic group pairs associated with this device in the past hour.
This graph shows the top 10 source IPs associated with this device in the past hour.
This graph shows the top 10 destination IPs associated with this device in the past hour.
This graph shows the summary traffic volume information for this device (MB/s).
This graph shows the summary interface traffic volume information for this device (MB/s).
A timeline of threat events associated with the device in the report period.
A table of all the interfaces associated with this device is displayed at the bottom of the page; the information presented includes:
- The device name.
- The ifIndex of the interface.
- The name of the interface.
- A description of the interface.
- Any alias given by the local user.
- The IP address associated with the interface.
- The nominal inward flow rate (MB/s), defined by the user.
- The nominal outward flow rate (MB/s), defined by the user.
- The average inward flow rate as a percentage of the nominal inward flow rate.
- The average inward flow rate (MB/s).
- The maximum inward flow rate as a percentage of the nominal inward flow rate.
- The maximum inward flow rate (MB/s).
- The average outward flow rate as a percentage of the nominal outward flow rate.
- The average inward flow rate (MB/s).
- The maximum outward flow rate as a percentage of the nominal outward flow rate.
- The maximum outward flow rate (MB/s).
Located at Dashboards > Interface Overview; there is also a unique Interface Overview subpage for each interface.
From the Dashboards menu, the Interface Overview option displays high-level summary information; some of this is also displayed in Server Overview. See Dashboards > Server Overview. The three graphs displayed are:
- Top Interfaces In (Last Hour v Last Week Hour), i.e. the interfaces with heaviest inward traffic over the past hour. This is compared to the same hour last week.
- Top Interfaces Out (Last Hour v Last Week Hour), i.e. the interfaces with heaviest outward traffic over the past hour. This is compared to the same hour last week.
- Summary Interfaces.
- Summary Interfaces Peak.
Figure: GigaFlow's Interface Overview page

Click once on any infrastructure device IP address or interface in the tables and you will be taken to an overview report for that device or interface. You can access the same overview using GigaFlow's search function. Search for the IP address and in the main left-hand side table, click the Infrastructure Device name. In the right-hand side table, click Overview.
Dedicated Interface Overview Pages
At the top of the page, you can see:
This panel displays the interface details:
- IfIndex: the interface number.
- The interface name.
- The interface alias.
- The interface description.
- The interface IP address.
- The interface MAC address.
- Speed In (MB/s).
- Speed Out (MB/s).
- Admin status.
- Oper status.
You can edit these at Configuration > Infrastructure Devices.
You can add an Attribute, or alias, for an interface by selecting from the interface Attributes drop down selector. See Configuration > Attributes for more. This panel lists attributes and useful tools associated with the selected interface, including:
- Attributes.
- Links out to useful tools, including Forensics, ARPs, CAMs, Live Interfaces and Traffic Overview.
- Links to associated integrations. See System > Global for more about integrations.
In addition, you will see graphs and tables of:
This is a summary of the total traffic for that interface.
This is a summary of the total inward traffic for that interface.
This is a summary of the total outward traffic for that interface.
This is a summary of the total inward packets for that interface.
This is a summary of the total outward packets for that interface.
A summary of the total inward flows for that interface.
This is a summary of the total outward flows for that interface.
DSCP (differentiated services code point) in summary information used for ingress policing configuration.
DSCP (differentiated services code point) out summary information used for ingress policing configuration.
DSCP (differentiated services code point) in summary information used for egress policing configuration.
DSCP (differentiated services code point) out summary information used for egress policing configuration.
Application traffic overview.
This graph shows the traffic associated with the busiest applications over the past hour. The information displayed includes:
- Avg Bits/s: average traffic per second per application.
- Percentage: this is the proportion of all traffic over the past hour seen by a particular application.
- Position relative to the same hour last week: this is the percentage increase or decrease in traffic per second per application compared with the same hour last week.
When more than ten applications are registered, the full list can be displayed by clicking the drill down icon. This displays a tabular version of all the data, with a CSV export option.
This graph shows the top 10 source IPs over the past hour; this is compared with the same hour a week before.
This graph shows the top 10 destination IPs over the past hour; this is compared with the same hour a week before.
This is a graph and table of traffic group bit rates, with a breakdown by individual traffic group. This is a summary of the busiest traffic groups across your network.
See Configuration > Traffic Groups for setup instructions.
When more than 10 traffic groups are registered, the full list can be displayed by clicking List All Drill down icon. beside the table title.
The CSV link at the top right of the table generates a .csv export.
This section provides an overview of the traffic associated with source IPs.
This graph shows the traffic associated with the busiest applications over the past hour. The information displayed includes:
- Avg Bits/s: average traffic per second per application.
- Percentage: this is the proportion of all traffic over the past hour seen by a particular application.
- Position relative to the same hour last week: this is the percentage increase or decrease in traffic per second per application compared with the same hour last week.
When more than ten applications are registered, the full list can be displayed by clicking the drill down icon. This displays a tabular version of all the data, with a CSV export option.
This graph shows the top 10 destination IPs over the past hour.
This graph shows the top 10 destination IPs over the past hour.
This is a graph and table of traffic source IP bit rates, with a breakdown by individual traffic group. This is a summary of the busiest traffic source IPs across your network.
When more than 10 traffic source IPs are registered, the full list can be displayed by clicking List All Drill down icon. beside the table title.
The CSV link at the top right of the table generates a .csv export.
This section provides an overview of the traffic associated with destination IPs.
This graph shows the traffic associated with the busiest applications over the past hour. The information displayed includes:
- Avg Bits/s: average traffic per second per application.
- Percentage: this is the proportion of all traffic over the past hour seen by a particular application.
- Position relative to the same hour last week: this is the percentage increase or decrease in traffic per second per application compared with the same hour last week.
When more than ten applications are registered, the full list can be displayed by clicking the drill down icon. This displays a tabular version of all the data, with a CSV export option.
This graph shows the top 10 source IPs over the past hour.
This graph shows the top 10 destination IPs over the past hour.
This is a graph and table of traffic destination IP bit rates, with a breakdown by individual traffic group. This is a summary of the busiest traffic destination IPs across your network.
When more than 10 traffic destination IPs are registered, the full list can be displayed by clicking List All Drill down icon. beside the table title.
The CSV link at the top right of the table generates a .csv export.
Located at Dashboards > Traffic Group Overview; there is also a unique Traffic Group Overview subpage for each Traffic Group.
From the Dashboards menu, the Traffic Group option displays summary information.
Traffic Group Subpages
Click once on any Traffic Group name in the table and you will be taken to an overview report for that Traffic Group. .
Click once on any of the "Down Arrows" beside the Traffic Group name in the table and you will be taken to the forensics report for that Traffic Group.
The overview for each Traffic Group includes graphs and tables with useful information (similar to device overviews). These include:
This graph shows the top 10 destination IPs over the past hour.
This graph shows the top 10 destination IPs over the past hour.
This graph shows the top 10 source IPs over the past hour.
This graph shows the top 10 destination IPs over the past hour.
This graph shows the source traffic associated with traffic groups over the past hour. The information displayed includes:
- Avg Bits/s: average traffic per second per application.
- Percentage: this is the proportion of all traffic over the past hour seen by a particular traffic group.
- Position relative to the same hour last week: this is the percentage increase or decrease in traffic per second per traffic group compared with the same hour last week.
When more than ten traffic group are registered, the full list can be displayed by clicking the drill down icon. This displays a tabular version of all the data, with a CSV export option.
This graph shows the destination traffic associated with traffic groups over the past hour. The information displayed includes:
- Avg Bits/s: average traffic per second per application.
- Percentage: this is the proportion of all traffic over the past hour seen by a particular traffic group.
- Position relative to the same hour last week: this is the percentage increase or decrease in traffic per second per traffic group compared with the same hour last week.
When more than ten traffic group are registered, the full list can be displayed by clicking the drill down icon. This displays a tabular version of all the data, with a CSV export option.
Located at Dashboards > Events.
From the Dashboards menu, the Events option displays summary information about events and exceptions. See also Dashboards > Server Overview. You can also click on Events item in the main menu to access the same information.
Some things that will trigger an event record include:
- Attempts to access blacklisted resources.
- Profile exceptions, i.e. behaviours deviating from norms. These are user defined at Configuration > Profiling.
- SYN flood event(s).
- Lost neighbour(s).
- New device(s) sending flows.
- Connected device(s) suddenly not sending flows.
On the Events page, you can see:
A timeline of all events in the reporting period, the Events Graph. A tabulated version of this information is shown underneath.
Figure: Events Graph
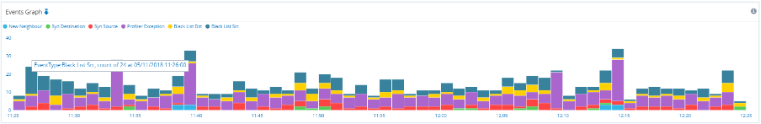
- Infographic of the number of event types by date and time; this is the Event Types infographic. Circle size indicates the number of events.
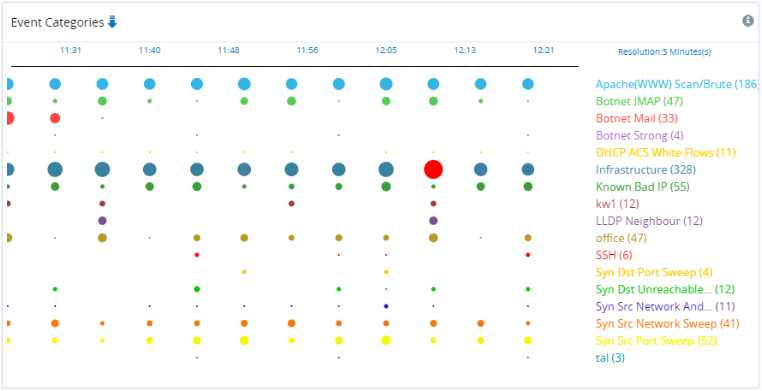
- Infographic of the frequency of occurence of particular event categories by date and time, i.e. number of times per time interval; this is the Event Categories infographic. Circle size indicates frequency.
- Infographic of the frequency of an event triggered by a particular source host by date and time; this is the Event Source Host(s) infographic. Circle size indicates frequency.
- Infographic of the frequency of an event targetted at a particular host by date and time, i.e. number of times per time interval; this is the Event Target Host(s) infographic. Circle size indicates frequency.
Figure: Event Categories infographic
- Infographic of the frequency with which each infrastructure device was affected by an event by date and time, i.e. number of times per time interval; this is the Infrastructure Devices infographic. Circle size indicates frequency.
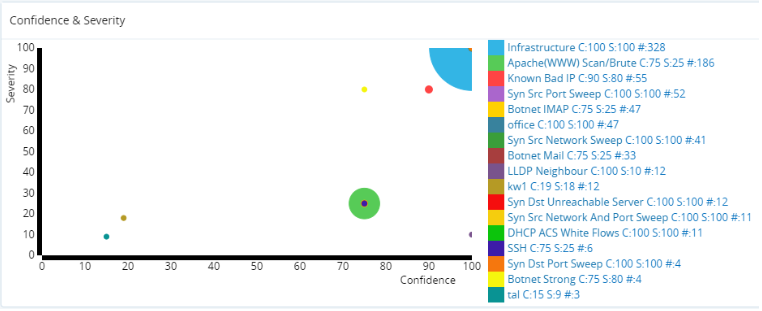
- Infographic of the frequency of an event by the measure of confidence in its identification, i.e. your confidence in the completeness and accuracy of the blacklist that the IP address was found in, and the severity of the threat to your network infrastructure, i.e. number of times per time interval; this is the Confidence & Severity infographic. Circle size indicates frequency.
Figure: Confidence & Severity infographic
By clicking once on any legend item, you will be taken to a detailed report, e.g. detailed reports for each Event Type, Source Host, Infrastructure Device, Event Category and Target Host.