Documentation >
Reference Manual for GigaFlow >
ReportsReports gives you access to system reports and logs. GigaFlow stores a record of all reports. Reports can be generated in many ways but most commonly by viewing a Forensics page; viewing a Forensics page automatically generates a report. When a report is generated by a user, it is cached by the system and can be accessed again almost immediately. In addition, all recorded reports can be re-run from scratch at any time. Runtimes vary with the scope of the report, i.e. reports that involve more data will take longer to complete. Typical reports for limited periods of time complete in seconds.
Administrators have access to all reports run by all users.
See Configuration > Reporting for more.
Located at Reports > My Current Queries.
My Current Queries lists your queries currently in process. The table includes:
- The user that initiated the report.
- Report source, e.g. Forensics. See Reports > Forensics.
- Report type, e.g. Application. See Forensic Report Types in the appendix.
- Output type, i.e. graph or table.
- When the report was started.
- Runtime.
- Size in bytes.
- Actions: view the cached report or re-run the report from scratch.
The filters used to define the report.
Located at Reports > My Complete Queries.
My Complete Queries lists your completed queries. The table includes:
- The user that initiated the report.
- Source, e.g. Forensics. See Reports > Forensics.
- Report type, e.g. Application. See Forensic Report Types in the appendix.
- Output type, i.e. graph or table.
- When the report was started.
- Runtime.
- Size in bytes.
- Actions: view the cached report or re-run the report from scratch.
- The filters used to define the report.
Located at Reports > All Complete Queries.
This option provides administrators with a view of all queries made by all users.
- The user that initiated the report.
- Source, e.g. Forensics. See Reports > Forensics.
- Report type, e.g. Application. See Forensic Report Types in the appendix.
- Output type, i.e. graph or table.
- When the report was started.
- Runtime.
- Size in bytes.
- Actions: view the cached report or re-run the report from scratch.
- The filters used to define the report.
This option provides administrators with a view of all forensic queries made by all users.
- MyID:
- User: The user that initiated the report.
- Source: Forensics. See Reports > Forensics.
- Report: Report type, e.g. Application. See Forensic Report Types in the appendix.
- Output: Output type, i.e. graph or table.
- Started At: When the report was started.
- Running For: Runtime, so far.
- Request:
Located at Reports > Canceled Queries.
Canceled Queries lists your canceled queries. The table includes:
- Source, e.g. Forensics. See Reports > Forensics.
- Report type, e.g. Application. See Forensic Report Types in the appendix.
- Output type, i.e. graph or table.
- When the report was started.
- Runtime.
- The reason for canceling the report.
- The filters used to define the report.
Located at Reports > Cluster Search.
Figure: Conducting a GigaFlow Cluster search
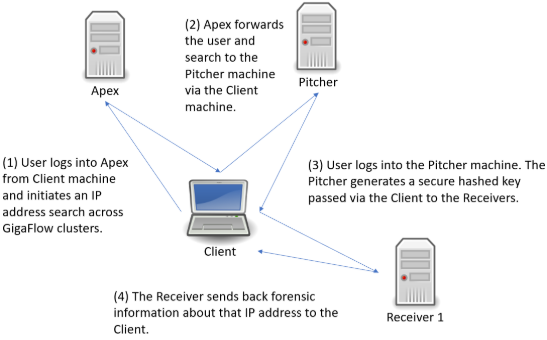
[file: Conducting a GigaFlow Cluster search.]
Following the search link from Apex, you will be brought to a new tab and the log in screen for the Pitcher machine. After logging in, you will be brought to the GigaFlow Cluster report page.
Figure: The initial view of the GigaFlow Cluster report page

This displays a list of hits for this IP address across the cluster; in this example, the IP address 172.21.21.21 was found on 11 devices monitored by three receivers. On these receivers the system found 9 devices with data matching the search and there were no errors.
In the first first table, each GigaFlow server is listed with:
- Server name.
- The URL to connect to the server; follow this link to access the full UI for that particular server.
- The type of result; in this case flows.
- Which device monitored by this server had the data.
- Device details: name, interface and the number of flows seen.
- A number and visualization of the data size; this is a ranking of result relevance.
- A drill-down link to forensics data for each result. A full view into the receiver is displayed below the top table; this allows you to view the results and interact with that GigaFlow server without having to leave this page.
Figure: Clicking on the drill down icon beside a result brings up the full user interface and a forensics report for that device on the associated GigaFlow server

The system allows ten minutes between running the report and viewing these results without re-authentication.
You can also select different report types to run on that device on that GigaFlow server by selecting from the drop-down menu. See Reports > Forensics in the main Reference Manual for more.
Located at Reports > DB Queries.
DB Queries displays a list of the most recent database queries. The information returned includes:
- The database accessed.
- The client requesting the query.
- The start time.
- The query duration.
- Wait events.
- Process ID.
- Query performed.
Located at Reports > Forensics.
See Configuration > Reporting for instructions on how to configure and create new report types. See Appendix > Forensic Report Types for a complete description of the different report types.
Forensics allows you granular, filterable reporting on the stored records. GigaFlow records flow posture, i.e. whether or not a flow is flagged as an excepted event, allowing for detailed analysis.
To create a report:
- Select a report type from the drop-down menu.
- Apply filters to the records to customize output.
- Multiple filters can be selected from the drop-down menu.
- Filters can also be entered using GigaFlow's Direct Filtering Syntax (see below).
- Select the Reporting Period.
- Choose the output type, i.e. graph or table, from the drop-down menu.
- Click on Save if you want to keep your report.
A router - an infrastructure device - has an IP of 192.0.2.1.This router was defined at Configuration > Infrastructure Devices.Choose an Applications report from the report type drop-down menu.Choose Infrastructure Device from the filter drop-down menu.Choose the router from the list of devices and apply the filter by clicking +.
The system will return a graph and/or table with details of:
- Source IP.
- Destination IP.
- Application.
- Bit rate and/or total bits.
- The reporting period is shown at the top right of the main body of the page. This is 2 hours by default.
- On login, the system displays information for the default time period.
- This default time period can be set in Configuration > Reporting in the main menu.
- Different reporting periods can be selected by clicking the from and to boxes.
Queries can be entered directly and quickly using the direct filtering syntax.
Direct Filtering Syntax| Field | Operators | Description | Example |
|---|
| srcadd | =, != | IP Address that the traffic came from. | srcadd=172.21.40.2 |
| dstadd | =, != | IP Address that the traffic went to. | dstadd=172.21.40.3 |
| inif | <, =, >, != | ifIndex of the interface through which the traffic came into the router. | inif=23 |
| outif | <, =, >, != | ifIndex of the interface through which the traffic left the router. | inif=25 |
| pkts | <, =, >, != | Number of packets seen in the flow. | pkts>100 |
| bytes | <, =, >, != | Number of bytes seen in the flow. | bytes<10000 |
| duration | <, =, >, != | Duration of flow in milliseconds. | duration>100 |
| srcport | <, =, >, != | Source IP port of flow. | srcport>1024 |
| dstport | <, =, >, != | Destination IP port of flow. | dstport=5900 |
| flags | <, =, >, != | TCP Flags of flow. flags=2 i.e. syn only. | Flags=CEUAPRSF |
| proto | <, =, >, != | IP Protocol Number/Type. | proto=16 |
| tos | <, =, >, != | TOS Marking. tos=104 | //Flash |
| srcas | <, =, >, != | Source AS Number. | srcas!=5124 |
| dstas | <, =, >, != | Destination AS Number. | dstas!=5124 |
| fwextcode | =, != | Forwarding Extended Code. | fwextcode='out-of-memory' |
| fwevent | =, != | Forwarding Event. | fwevent!='Flow Deleted' |
| tgsource | =, <> | Traffic Group Source. | fwextcode<>'My network 1' |
| tgdest | =, <> | Traffic Group Destination. | tgdest<>'Other' |
- Ranges are also supported for IP address, port and AS fields. i.e. "dstport in (22,23,80,443) will match any flow where the dstport is either of the specified ports.
- Logical operators "and", "or", "not" as well as parentheses can also be used. i.e. "dstport not in(23,2055,443) and srcport not in (8585,23) and (fpr > 0 or pkts < 100)".
- It is possible to check the bit value of a field using the bitand function i.e. "(flags bitand 4)=4" filters for flows with the Reset flag set.
Located at Reports > First Packet Response.
First Packet Response (FPR) is a useful diagnostic tool, allowing you to compare the difference between the first packet time-stamp of a request flow and the first packet time-stamp of the corresponding response flow from a server. By comparing the FPR of a transaction with historical data, you can troubleshoot unusual application performance.
On loading, this page displays any First Packet Response information available for Monitored Servers.
Figure: The First Packet Response reports page

To set up a monitored server, go to Configuration > Server Subnets.
The displayed information includes:
- Device IP address.
- Server subnet.
- Port number.
- Number of clients.
- Number of flows.
- Time and date last seen.
- Basic statistics.
On loading, this page displays any First Packet Response information available for Monitored Servers.
Figure: The First Packet Response reports page

To set up a monitored server, go to Configuration > Server Subnets.
The displayed information includes:
- Device IP address.
- Server subnet.
- Port number.
- Number monitored clients.
- Number of flows, maximum number of clients.
- Maximum number of flows per minute.
- Minimum response time.
- Average response time.

Click the Ticker check box next to a device to enable a ticker in the table below with live response times in milliseconds.
A network audit report is a standard-format JSON object that contains a summary of all the devices registered by GigaFlow that belong to a particular subnet.
Network audit reports are enabled for a particular subnet at Reports > System Wide Reports > Subnet List. Enabling a network audit runs the network audit script for the selected subnet(s). You can view the network audit script at System > Event Scripts.
Server configuration happens at Configuration > Server Subnets.
Located at Reports > Saved Reports.
Newly generated reports of interest can be saved for reference. Click Save  in the top right corner.
Once a report has been saved it can be viewed in two ways: (i) open. This opens without running. More filters can be added; (ii) open and run.
Saved Reports are listed with the following information:
- Who created the report.
- Where the report originated, e.g. Forensics.
- Report type.
- Report name.
- Action.
- Description.
- Additional filtering.
- When it was created.
Each automatically discovered server is listed here with:
- Device: this is the IP address of the server.
- Capacity:
- Src Monitored Sessions:
- Src Threshold:
- Dst Monitored Sessions:
- Dst Threshold:
Clicking on a device brings up detailed information for that server.
Details about each discovered server are shown here, with information about its behaviour as a source and destination for traffic. Two tables are shown on screen.
- IP: IP address
- Port:
- Application:
- Flows:
- IP:
- Port:
- Application:
- Flows:
Located at Reports > System Wide Reports.
These are static reports produced by GigaFlow. From the Reports menu, the System Wide Reports option expands to display a further five options:
- SYN Forensics Monitoring
- Device Connections
- MAC Address Vendors
- Subnet List
- Flow Stats
Located at Reports > System Wide Reports > SYN Forensics Monitoring.
GigaFlow monitors all TCP flows where only the SYN bit is set. In normal network operations, this indicates that a flow has not seen a reply packet while active in a router's Netflow cache.
A lonely SYN can be an indicator that:
- Routing was asymmetric. Perhaps the reply returned via a different router.
- Reply traffic was blocked.
- Servers were not responding for some reason.
- Something was probing the network.
GigaFlow creates an alert when:
- SYN Source Network Sweep: alerts if a source IP address fails to get a response from more than IP Address Count Threshold unique destination addresses.
- SYN Source Port Sweep: alerts if a source IP address fails to get a response from more than Port Count Threshold unique destination ports.
- SYN Source Network And Port Sweep: alerts if a source IP address exceeds both Port Count Threshold and IP Address Count Threshold thresholds.
- SYN Destination Unreachable Server: alerts if a destination IP address fails to respond to more than IP Address Count Threshold unique destination addresses.
- SYN Destination Port Sweep: alerts if a destination IP address fails to respond to more than Port Count Threshold unique destination ports.
- SYN Destination Network And Port Sweep: alerts if a destination IP address exceeds both Port Count Threshold and IP Address Count Threshold.
On the SYN Forensics Monitoring page, you can find two tables of information:
- SYN Sources.
- SYN Destinations.
Each table lists the following information:
- Source or destination IP addresses.
- The number of destinations or sources.
- The number of destination ports.
- The number of flows.
- The type of SYN, e.g. network sweep.
- When it was first seen.
- When it was last seen.
See also System > Alerting
Located at Reports > System Wide Reports > Device Connections.
This page lists all known network connected devices. This list is used as a look-up for Layer-2 to Layer-3 connectivity.
The table lists:
- Device.
- Device name.
- Interface.
- Interface name.
- VLAN.
- VLAN ID.
- MAC address.
- IP address.
- User
- MAC vendor.
Clicking the export icon beside the page title creates a .csv file for download or printing.
Located at Reports > System Wide Reports > MAC Address Vendors
This page shows information about devices associated with particular MAC vendors on your network; GigaFlow displays:
- The MAC vendor name.
- The number of times devices from that vendor has been seen, Count.
Click on Count to populate the second table, MAC Addresses. These are the individual devices associated with that vendor. For each device, the table shows:
- Device MAC address.
- When it was last seen on Layer-2.
- When it was last seen on Layer-3.
The Subnet List report summarises all the subnets automatically discovered using SNMP. The details listed are:
- Device Name: the server name.
- Device IP: the server IP address.
- IfIndex: the interface index.
- Name: the interface name.
- Subnet IP: the subnet IP address.
- Subnet: the subnet name.
- Mask: the subnet mask.
- Alias: the subnet alias.
- Description: the subnet description.
- Speed In: the inward bit rate (MB/s).
- Speed Out: the outward bit rate (MB/s).
- Admin: admin status.
- Oper: oper status.
- Audit: audit status.
This report summarises infrastructure devices by flow rate, showing a graph and table listing, for each device:
- Device name and IP address.
- Flow rate (flows per second) and total flows over the report period.
- The maximum flow rate and time it occurred.
- The percentage of the total number of flows over the report period contributed by this device.
Located at Reports > SQL Report.
Select how many of the most recent SQL Queries to view from the drop-down menu, i.e. the most recent 10, 50, 100 or All.
The table lists the following information:
- Query ID.
- Date created.
- User that created the query.
- Name of the query.
- What the query was.
- To run the report with a HTML output, click HTML.
- To run the report with a .csv output, click CSV.
- Click Edit
 to modify the report.
 - Click Remove
 to remove the report.
- To add a SQL report, enter a name and then Save .
- The new report will appear in the SQL Report Filters Table.
- Click Edit to open and modify the report.
Located at Reports > User Events.
Select how many of the most recent User Events to view, i.e. the most recent 50, 100, 250 or 500 events.
This table gives information about:
- Event date/time.
- User requesting the event, if you are logged in as an administrator.
- Source IP address.
- Category of event, e.g. a login or a report.
- The action or function performed.
- JSON parameters.
GigaFlow's IpViewer2 uses MapBox to visualise the physical location of IP addresses
- User:
- Device:
- IP:
- Switch:
- Router:
- Bandwidth:
- Apps:
- Bandwidth:
- Hosts: