Observer GigaFlow
Table of Contents
- Legal
- Glossary
- Introduction
- About GigaFlow
- How-To Guide for GigaFlow
- First Steps
- Install GigaFlow on a Windows Platform
- Log In and Provision GigaFlow
- Conducting Searches in GigaFlow
- Search for Security Events Associated with an IP Address
- Conduct a Search and Apply a Macro or Script
- Search for a Username
- Search for a Network Switch
- Diagnostics and Reporting
- Explore Bandwidth Usage by Interface and Application
- Identify Bandwidth Usage by User
- Use First Packet Response to Understand Application Behaviour
- Determine if Bad Traffic is Affecting Your Network
- Create a Script
- Create a Traffic Group
- Create and Use a Profile
- Create an Integration
- Respond to a Blacklist Email Alert
- Alerts and Events
- Determine the Importance of an Event
- Investigate a SYN Anomaly
- Configuration and System Set-up
- Working with Clusters of GigaFlow Servers from Viavi Apex
- FAQs and Troubleshooting
- Which Web Browers Are Supported by GigaFlow?
- What Server Specification Do We Need?
- Does GigaFlow have an API?
- Does GigaFlow Require a Client?
- Reference Manual for GigaFlow
- Log in
- User Interface Overview
- GigaFlow Search
- Overview
- Search Scope
- Searching by IP Address
- Searching by MAC Address
- Searching by Username
- Searching for a Specific Network Switch
- Graphical Flow Mapping
- Dashboards
- Performance Overview
- Top Devices (Last Hour v Last Week Hour)
- Top Interfaces (Last Hour v Last Week Hour)
- Top Traffic Groups (Last Hour v Last Week Hour)
- Top Applications (Last Hour v Last Week Hour)
- Top Source Addresses (Last Hour v Last Week Hour)
- Top Destination Addresses (Last Hour v Last Week Hour)
- Server Overview
- Device Overview
- Device Details
- Attributes and Tools
- Top 10 Applications This Hour
- Top 10 Traffic Group Pairs This Hour
- Top 10 Source IPs This Hour
- Top 10 Destination IPs This Hour
- Summary Devices
- Summary Interfaces
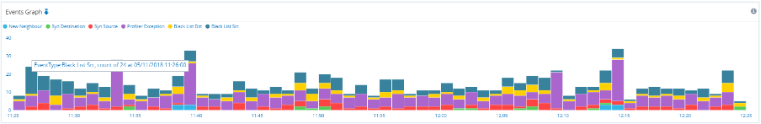
- Events Graph
- All Interfaces CSV
- Interface Overview
- Interface Details
- Attributes and Tools
- Summary Interface Total Traffic
- Summary Interface In
- Summary Interface Out
- Summary Interface In Packets
- Summary Interface Out Packets
- Summary Interface In Flows
- Summary Interface Out Flows
- Summary Interface DSCP In Ingress Bytes
- Summary Interface DSCP Out Ingress Bytes
- Summary Interface DSCP In Egress Bytes
- Summary Interface DSCP Out Egress Bytes
- Application Overview
- Top Applications (Last Hour v Last Week Hour)
- Top Source Addresses (Last Hour v Last Week Hour)
- Top Destination Addresses (Last Hour v Last Week Hour)
- Summary Traffic Applications
- Source IP Overview
- Top Applications (Last Hour v Last Week Hour)
- Top Source Addresses (Last Hour v Last Week Hour)
- Top Destination Addresses (Last Hour v Last Week Hour)
- Summary Traffic Source IPs
- Destination IP Overview
- Top Applications (Last Hour v Last Week Hour)
- Top Source Addresses (Last Hour v Last Week Hour)
- Top Destination Addresses (Last Hour v Last Week Hour)
- Summary Traffic Destination IPs
- Traffic Group Overview
- Top Traffic Groups Sources (Last Hour v Last Week Hour)
- Top Traffic Groups Destinations (Last Hour v Last Week Hour)
- Top Traffic Groups Sources (Last Hour v Week Last Week Hour)
- Top Traffic Groups Destinations (Last Hour v Week Last Week Hour)
- Summary Source Traffic Groups
- Summary Destination Traffic Groups
- Events
- Threat Map
- Events (Main)
- Profiling
- Realtime Overview
- Profiling Events
- (Existing) Traffic Groups
- Overview
- Top Traffic Groups Sources (Last Hour v Last Week Hour)
- Top Traffic Groups Destinations (Last Hour v Last Week Hour)
- Top Traffic Groups Sources (Last Hour v Week Last Week Hour)
- Top Traffic Groups Destinations (Last Hour v Week Last Week Hour)
- Summary Source Traffic Groups
- Summary Destination Traffic Groups
- Reports
- My Current Queries
- My Complete Queries
- All Complete Queries
- All Current Forensics
- Canceled Queries
- Cluster Search
- DB Queries
- Forensics
- First Packet Response
- Network Audits
- Saved Reports
- Server Discovery
- Server Discovery/Detailed Information
- System Wide Reports
- SQL Reports
- User Events
- IpViewer2
- Configuration
- Applications
- Configuration - Applications
- Existing Defined Application
- Existing Flow Objects
- Existing Protocol/Port Applications
- Attributes
- GEOIP
- Infrastructure Devices
- Detailed Device Information
- Configuration/Profiling
- Reporting
- New Report Link
- Import Report Link
- General
- Forensics Reports
- Existing DSCP Names
- New DSCP Name
- Existing Report Links
- Server Subnets
- Traffic Groups
- System
- Alerting
- Event Scripts
- GigaFlow Cluster
- This Server
- New Cluster Server
- Cluster Access
- Search the GigaFlow Cluster
- Encryption and GigaFlow Clusters
- Global
- General
- LDAP
- SSL
- Import
- Export
- Remote Services
- SNMP V2 Settings
- SNMP V3 Settings
- Log Setting
- Proxy Setting
- MAC Vendors
- Mail Settings
- Storage
- Data Retention and Rollup
- Integrations
- Add Observer GigaStor
- Licenses
- GigaFlow License
- 3rd Party Licenses
- Cleartext Communication
- Call Home Send
- Call Home Response
- Call Home Errors
- License
- Receivers
- Syslog Parsers
- System Health
- System Status
- Users
- Existing Users
- Add Local User
- Add User Group
- Existing User Groups
- Existing LDAP Groups
- Add LDAP User
- Add LDAP Group
- Existing LDAP Nested Groups
- Existing Portal Users
- Add Portal User
- Existing Data Access Groups
- Add Data Access Group
- Watchlists
- Appendices
- Forensic Report Types
- Application
- ASs by Dst
- ASs by Source
- ASs Pairs
- Address Pairs
- Addresses As Sources And Dest Port By Dest Count (Edit?)
- Addresses By Dest
- Addresses By Source
- All Fields
- All Fields Avg FPR
- All Fields Max FPR
- Application Flows
- Application Flows With User
- Applications With Flow Count
- Class Of Service
- Duration Avg
- Duration Max
- FW Event
- FW Ext Code
- Interface Pairs
- Interface By Dest
- Interfaces By Destination Pct
- Interfaces By Source
- Interfaces By Source Pct
- MAC Address Pairs
- MAC Addresses By Dest
- MAC Addresses By Source
- Ports As Dest By Dest Add Popularity
- Ports As Dest By Src Add Popularity
- Ports As Src By Dest Add Popularity
- Ports As Src By Src Add Popularity
- Ports By Dest
- Ports By Source
- Posture
- Protocols
- Servers As Dest With Ports
- Servers As Dst Address
- Servers AS Src Address
- Servers As Src With Ports
- Sessions
- Sessions Flows
- Sessions With Ints
- Subnet Class A By Dest
- Subnet Class A By Source
- Subnet Class B By Dest
- Subnet Class B By Source
- Subnet Class C By Dest
- Subnet Class C By Source
- Subnet Class C Destination By Dest IP Count
- Subnet Class C Source By Source IP Count
- TCP Flags
- Traffic Group By Dest
- Traffic Group By Source
- Traffic Group Pairs
- URLs
- USers (Report)
- TCP Flags