Documentation >
Reference Manual for GigaFlow >
SystemFigure: The System Settings menu
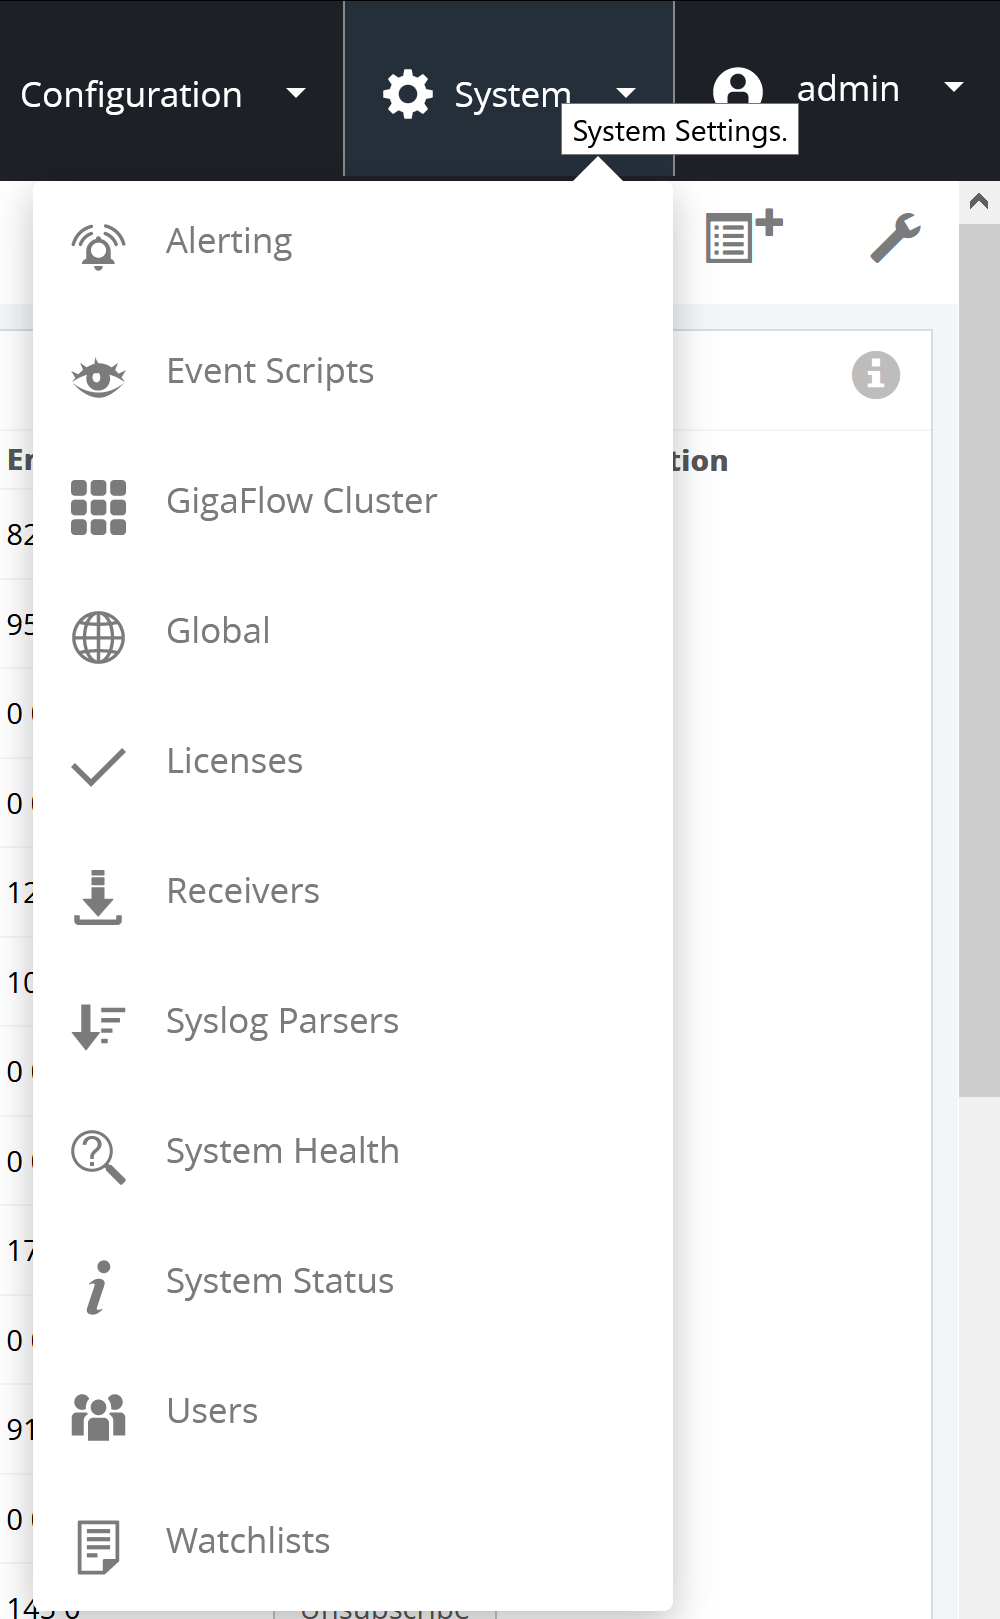
This is where you can make changes to the system settings.
Located at System > Alerting.
Configure GigaFlow to alert you when something happens. Syslog or mail alerts can be set up for any of the following:
- SYN Source Network Sweep: alerts if a source IP address fails to get a response from more than IP Address Count Threshold unique destination addresses.
- SYN Source Port Sweep: alerts if a source IP address fails to get a response from more than Port Count Threshold unique destination ports.
- SYN Source Network And Port Sweep: alerts if a source IP address exceeds both Port Count Threshold and IP Address Count Threshold thresholds.
- SYN Destination Unreachable Server: alerts if a destination IP address fails to respond to more than IP Address Count Threshold unique destination addresses.
- SYN Destination Port Sweep: alerts if a destination IP address fails to respond to more than Port Count Threshold unique destination ports.
- SYN Destination Network And Port Sweep: alerts if a destination IP address exceeds both Port Count Threshold and IP Address Count Threshold thresholds.
- Blacklist source.
- Blacklist destination.
- Profile exceptions.
- A device restarts sending flows.
- A device stops sending flows.
To configure a system log alert:
- Toggle the Yes or No options for any of alert situations.
- You can set and save the server(s) address(es) below. The syslog server(s) input can have multiple entries, separated by a comma, e.g.
172.16.254.1, 172.16.254.2
- Each entry can also have a port, facility and warning level set using the format:
IP_Address:Port:Facility:Level
e.g. 172.21.40.1:515:4:23,172.21.40.2:516:23:4
- In this example, messages are sent to 2 servers; the first is on port 515 and the second is on port 516. Both are using the "Local 7" Facility and the "Warning" level. See syslog at Wikipedia for more.
- Click Save
 to store the server address.
 - Sent alerts are displayed with the following information:
- Address.
- Port.
- Facility, e.g. Local 7.
- Level, e.g. Warning.
- Sent.
Sample Syslog Message Types
{"Application":"HTTPS TCP/443","Eventer":"172.0.0.1","Profile":"Facebook","appid":393659,"bytes":1447,"device":"172.0.0.1","domain":"","dstadd":"172.0.0.1","dstport":50561,"duration":288,"eventname":"Profiler","flags":26,"fwevent":0,"fwextcode":0,"inif":12,"macdst":"00:00:00:00:00:00","macsrc":"00:00:00:00:00:00","outif":30,"packets":10,"proto":6,"srcadd":"172.0.0.1","srcport":443,"time":1475147589242,"timeH":"29-Sep-2016 12:13:09.242","tos":40,"user":""}{"Application":"BitTorrent TCP/6881","Black List":"http://lists.blocklist.de/lists/bots.txt","Black List Type":"Source","Eventer":"172.0.0.1","appid":400097,"bytes":120,"device":"172.0.0.1","domain":"","dstadd":"172.0.0.1",
"dstport":63533,"duration":1380, "eventname":"Black List Src","flags":20,"fwevent":0,"fwextcode":0,"inif":12,"macdst":"00:00:00:00:00:00","macsrc":"00:00:00:00:00:00","outif":30,"packets":3,"proto":6,"srcadd"
- "172.0.0.1","srcport":6881,"time":1475147643237,"timeH":"29-Sep-2016 12:14:03.237","tos":40,"user":""}
{"Application":"TCP/49755","Eventer":"172.0.0.1","Syn Type":"Source","appid":442971,"bytes":152,"device":"172.0.0.1","domain":"","dstadd":"172.0.0.1","dstport":54350,"duration":1804,"eventname":"Syn Src Network Sweep", "flags":2,"fwevent":0,"fwextcode":0,"inif":30,"macdst":"00:00:00:00:00:00","macsrc":"00:00:00:00:00:00","outif":12,"packets":3,"proto":6,"srcadd":"172.0.0.1","srcport":49755,"time":1475147666238,"timeH":"29-Sep-2016 12:14:26.238","tos":0,"user":""}{"Application":"TCP/34056","Eventer":"172.0.0.1","Syn Type":"Destination","appid":427272,"bytes":152,"device":"172.0.0.1","domain":"","dstadd":"172.0.0.1","dstport":34056,"duration":1124,"eventname":"Syn Dst Port Sweep","flags":2,"fwevent":0,"fwextcode":0,"inif":14,"macdst":"00:00:00:00:00:00","macsrc":"00:00:00:00:00:00","outif":30,"packets":3,"proto":6,"srcadd":"172.0.0.1","srcport":57058,"time":1475147662254,"timeH":"29-Sep-2016 12:14:22.254","tos":0,"user":""}The IP addresses in these sample Syslog messages have been replaced with 172.0.0.1.
To configure a system email alert:
Toggle the Yes or No options for any of alert situations.Click Save to store the server address.
This table lists different possible event triggers with options to: (i) create and event and (ii) trigger a script to run.
The event triggers include:
- Netflow Unknown.
- Netflow TCA.
- Netflow Route Change.
- Netflow Immitigable.
- Netflow Bandwidth.
- Netflow Egress Measurement.
- Netflow Ingress Measurement.
Located at System > Event Scripts.
This is where you can add your own scripts to create new workflows. A table lists existing scripts with the following information:
- Script ID.
- Script name.
- Script description.
- Script length in bytes.
- Who created the script, e.g. Admin.
- Time and date the script was created.
- Is the script currently running? Yes or No.
- The memory occupied by the script.
- How many times the script has been run.
- Average runtime in milliseconds.
- The number of trigger events.
- The number of dropped trigger events.
- The trigger for the script.
- Any errors.
- Actions:
To add a script:
- Click + in the top right.
- Enter a name and description.
- Select a trigger event from the drop-down menu. Possible triggers are:
- Not set.
- 1 Minute.
- 5 Minute.
- 15 Minute.
- All ARP.
- Black List Dst.
- Black List Src.
- Daily.
- Device Restarts Sending Flows.
- Device Stops Sending Flows.
- Hourly.
- Lost Neighbour.
- New ARP.
- New Device.
- New IP.
- New MAC.
- New Neighbour.
- One Off.
- Profile Exception.
- Sys Dst Network and Port Sweep.
- Syn Dst Port Sweep.
- Syn Dst Unreachable Server.
- Syn Src Network and Port Sweep.
- Syn Src Network Sweep.
- Syn Src Port Sweep.
- Syslog.
- Enter the script in the main text box.
- All scripts are JavaScript; the engine is Oracle's Nashorn.
- Click Save .
Located at System > GigaFlow Cluster.
A single GigaFlow server can be configured to search for IP addresses across many remote GigaFlow servers directly from Viavi's Apex system. This feature is useful for large organisations that may have many GigaFlow servers monitoring different networks within the organisation, e.g. in different regions. The central administrator may want a view across the entire network, e.g. to determine if a particular suspect IP address has been recorded by routers on different networks.
In this example, assume that you are the main administrator and you want visibility on several remote GigaFlow servers.
The set-up is:
- GigaFlow Server #0: this is the server at HQ, used by the main administrator. We call this the Pitcher.
- GigaFlow Server #1: this is remote GigaFlow server #1. We call this Receiver 1.
- GigaFlow Server #2: this is remote GigaFlow server #2. We call this Receiver 2.
- GigaFlow Server #3: this is remote GigaFlow server #3. We call this Receiver 3.
Figure: Defining a GigaFlow cluster
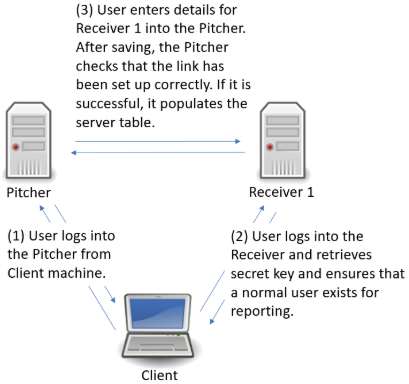
Log in to GigaFlow Server #0, the Pitcher, and navigate to System > GigaFlow Cluster.
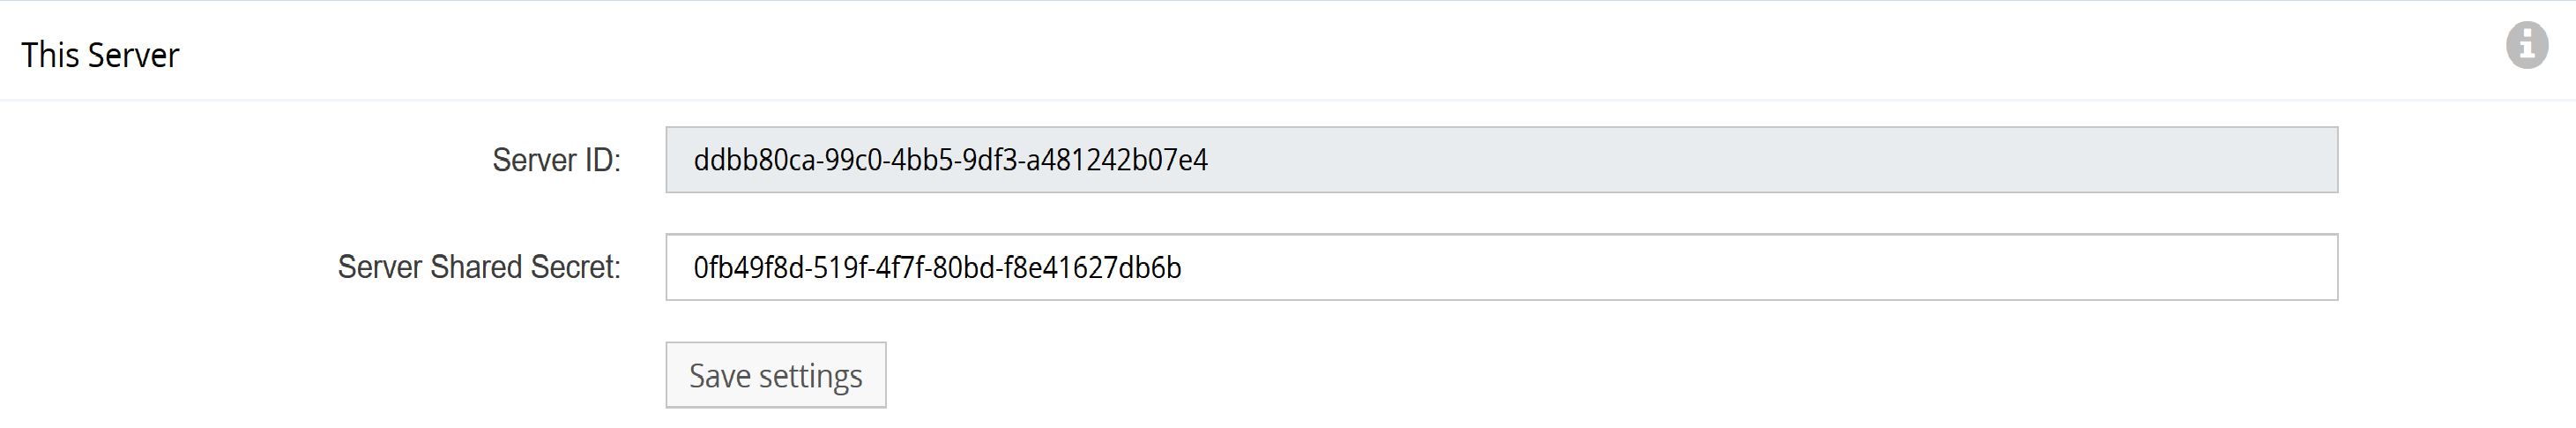
In the This Server panel, you will see a pre-generated unique secret. Leave this as is.
In another browser tab or window, log into Receiver 1 (GigaFlow Server #1). Copy the unique secret from Receiver 1's This Server panel. You do not need to do anything with the New Cluster Server panel on the receivers.
Figure: This Server panel
Switch back to the Pitcher (GigaFlow Server #0). In the New Cluster Server panel:
- Enter a name that you will see during a search across servers, i.e. Receiver 1.
- Enter the description that you will see when hovering-over the server name during a search across servers, e.g. "EMEA GigaFlow server (Receiver 1)".
- Enter the full IP address, including port number, used to connect to Receiver 1, i.e. in the format "http(s)://172.1.1.0:22".
- Enter the IP address of the Pitcher system as seen by Receiver 1. This IP address is used by the Pitcher to generate a secure hashed key for communication. The Receiver reverses this hash using, among other things, the IP address of the Pitcher. An intermediate firewall (NAT) could create problems if the Pitcher does not create the hashed key using the IP address seen by the Receiver.
- Enter the UserID used when making superuser calls to Receiver 1, e.g. Admin. This is used during this set-up process.
- Enter the UserID that will be used when making report requests, e.g. reportuser; this is used by all clients when collecting data from the Receiver. This user must exist on Receiver 1. If it does not exist, switch to Receiver 1 and create a new normal user on Receiver 1, i.e. reportuser.
- Paste Receiver 1's secret, i.e. the key copied from Receiver 1's This Server panel.
- Click Save to add the Receiver 1.
- The Pitcher will connect to Receiver 1 using the Admin user to verify that everything is correct and to populate the table at bottom of the System page. Receiver 1 will appear in the main table.
Figure: New Cluster Server panel
Repeat this process for Receiver 2 and Receiver 3.
The cluster server feature is flexible; a receiver in one cluster can be a pitcher for another.
The Cluster Access panel shows cluster access status. The table lists:
- ID: Cluster ID.
- Added: Time and date.
- By: User.
- Net State: network state, up or down.
- Admin State: admin status, i.e. details on its operation.
- Reporter State: success or fail.
- Settings: JSON object.
- Actions: delete.
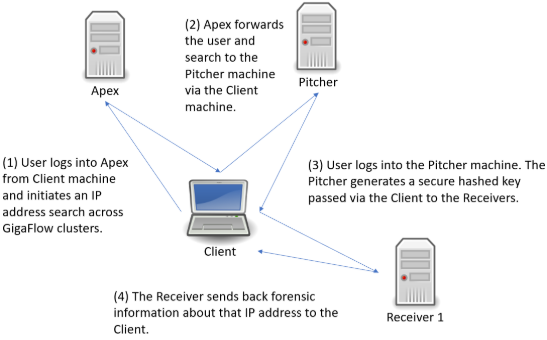
Following the search link from Apex, you will be brought to a new tab and the log in screen for the Pitcher machine. After logging in, you will be brought to the GigaFlow Cluster report page. This displays a list of hits for this IP address across the cluster; in this example, the IP address might be found on devices monitored by all three receivers. Clicking on a receiver name brings up the forensics report summary for that IP address from that receiver in the table at the bottom of the summary page. Alongside each receiver on the results page is a link out to that particular server.
Figure: Conducting a GigaFlow Cluster search
See also Reports > Cluster Search.
Communication between all clients in a Gigaflow cluster is IP to IP, i.e. unicast. The traffic is routed over https, using TLS based on certificates.
New icons along top.
Located at System > Global.
You can find most of the system-wide settings here.
Along the top of the page are quick links to the different settings options. These are:
- General.
- LDAP.
- SSL.
- Import/Export.
- Remote Services.
- SNMP V2.
- SNMP V3.
- Log.
- Proxy.
- MAC Vendors.
- Mail.
- Storage.
- Integrations.
In the General settings box, you can change:
- Server name. This is the name associated with the GigaFlow server and does not have to be the same as the hostname. This is the name used when when the server calls the GigaFlow home servers. It aids identification.
- Theme: light or dark.
- Display IP address on login? Yes or No.
- Max number of First Packet Response Clients. This is the maximum number of First Packet Response clients supported by the system and any one point in time. 400 is the default.
- Max memory IPs, 300,000 by default. This is the maximum number of IP addresses that can be cached in RAM before writing to disk. It functions as a memory table lookup for GigaFlow Search. In general, there is no need for you to change this. The aim is to reduce disk read and writes.
- TCP Testing Ports, e.g. 22, 23, 80, 443, 3389, 1143, 21.
- TCP Testing Timeout, e.g. 200 ms.
- TCP Port Threads, e.g. 4.
- TCP Device Threads, e.g. 4.
- TCP Syn Port Threshold, e.g 5.
- TCP Syn Address Threshold, e.g 10.
- Duplicate Cache Size, e.g 90. This is the number of flows that each devices should cache in order to try and detect duplicates. It will use the start/end time, src/dst port and IP address as well as the byte and packet count to match.
- Process Duplicate Flows: Yes or No.
- Ignore Duplicates On Summaries: Yes or No.
- SNMP Timout: 2000 milliseconds.
- Server Discovery Limit: default is 100 servers.
- Server changes require a system restart.
- Server Auto Discovery Enabled: Yes or No.
- Web Session Timeout: default is 30 minutes.
Before you can authenticate users using LDAP or AD, you must set the LDAP (Lightweight Directory Access Protocol) server.
Examples for an LDAP server integration :
- Server address, e.g. ldap://172.21.40.189:389.
- LDAP Group DN, the branch that should be searched to return a list of groups from e.g. ou=observer,dc=viavi,dc=solutions
- LDAP Group Field, the dn of the field to return e.g. entryDN
- LDAP Group Search,the filter to use when searching for groups e.g. (&(objectClass=groupOfNames))
- LDAP Group Search Filtered, the filter to use in the users page when filterling the list of available groups e.g. (&(objectClass=groupOfNames)(cn=$FILTER))
- LDAP User DN Base, the branch from which to search users e.g. ou=users,dc=viavi,dc=solutions
- LDAP User DN Field, the DN for the users e.g. entryDN
- LDAP Users Group Field, the filed representing the users group membership e.g. memberOf
- LDAP User Filter,the filter to apply when searching for users e.g. (&(objectClass=inetOrgPerson)(uid=$USERID))
- Username, the dn of the user to bind when searching the server e.g. cn=admin,dc=viavi,dc=solutions
- Domain Name, not required for NON AD servers e.g. LEAVE BLANK
- Password, e.g. XXXXXXXXXX
- Status, i.e. if the connection is good and how many LDAP groups have been retrieved.
Examples for Active Directory server integration :
- Server address, e.g. ldap://172.21.40.189:389.
- LDAP Group DN, e.g. dc=anuview,dc=net
- LDAP Group Field, e.g. distinguishedName
- LDAP Group Search, e.g. (&(objectClass=group))
- LDAP Group Search Filtered, e.g. (&(objectClass=group)(cn=$FILTER))
- LDAP User DN Base, e.g. dc=anuview,dc=net
- LDAP User DN Field, e.g. cn
- LDAP Users Group Field, e.g. memberOf
- LDAP User Filter, e.g. (&(objectClass=user)(sAMAccountName=$USERID))
- Username, e.g. Administrator
- Domain Name, e.g. anuview.net
- Password, e.g. XXXXXXXXXX
- Status, i.e. if the connection is good and how many LDAP groups have been retrieved.
In the SSL settings box, you can view and select or change:
- Existing certificate aliases.
- Keystore location on the network or server. Leave this blank for default setting.
- Keystore password. Leave this blank for default setting.
- Click Save Keystore Settings.
Saving will restart the HTTPS service which may take up to one minute.
The Import and Export windows allow you to easily import or export all of your GigaFlow configuration and system settings.
To import GigaFlow configuration and system settings:
- Click Import
- Copy the text version of the new configuration and system settings.
- Paste this text into input window.
- Click Save new configuration and system settings to enter and save the new configuration and system settings.
To export your GigaFlow configuration and system settings:
- Use the first icon from the left, above the main tabs, to Export configuration and system settings.
- Copy and paste this text into a text editor, e.g. Notepad, and save it.
ZeroMQ
- Status: default, Not Configured.
- Listener: default, '*.5555.
- Cache Period (milliseconds): default, 60000.
- Cache Size: default, 100000.
- Max Flows Transmitted Per Message: default, 100000.
- Max Seconds Per Message: default, 60000.
- Message Store:
- Restart required.
- Message Store Max Size MB: default, 50000.
Save ZeroMQ Settings.
Observer GigaStor
- URL.
- Display.
- User Name.
- Password.
- Status.
- Actions.
Kafka
- Status: No status for now.
- Broker: enter the Kafka broker address.
- SSL Trust Store: path to trust store.
- Trust Store Pass: password.
- Topic: default, gigaflowraw.
- Group ID: group name.
- Cache Period (milliseconds): default, 300000.
- Cache Size: 5000.
Save Kafka Settings.
Syslog Forensics
- Status: for example, has sent w packets , x dropped, y largest, z, longest t (ms).
- Format: Text or JSON.
- Storage Buffer: 10000.
- Server: IP address and port in the format xxx.xxx.xxx.xxx:xx
- A change requires a restart to affect all devices.
- Cache Period (milliseconds): 300000.
- A change requires a restart to affect all devices.
- A change requires a restart to affect all devices.
Save Syslog Settings.
Click the second icon from the left, above the main tabs, to add an SNMP v2 Settings Commuity.
- Enter the community name in the text box and click Save.
SNMP allows GigaFlow to poll sending devices. GigaFlow supports multiple concurrent pollers. Each device is serviced every 30 minutes. SNMP polling is used to retrieve:
- Device information, i.e. location, sysOID, interface names, descriptions, aliases and IP addresses.
- ARP table for IP address to MAC address to interface mapping.
- CAM table for MAC to switch port mapping.
In the SNMP V2 settings box, you can add or delete new SNMP V2 community strings. To add or delete a community string:
- Delete existing communities by clicking the delete icon.
Click the third icon from the left, above the main tabs, to add an SNMP v3 Settings Commuity.
- Enter the new SNMP V3 community name.
- Enter a user name.
- Authentication Type, i.e. MD5 or SHA secure hash functions.
- Enter an authentication type password.
- Privacy Type, i.e. AES-128, AES -198, AES-256, DES or 3DES.
- Enter a privacy password.
- Enter a context. SNMP contexts provide VPN users with a secure way of accessing MIB data. See Cisco and the Glossary for more.
- Submit by clicking Save.
SNMP allows GigaFlow to poll sending devices. In the SNMP V3 settings box, you can view and delete SNMP v3 community strings.
In the Log settings box, you can view the log file and change the logging level:
- Click on Log File to view the log file entries.
- Select a logging level from the drop-down menu, i.e. DEBUG, INFO, ERROR, FATAL, WARN.
- Click Save to save changes to the logging level.
These are the proxy settings used to access GigaFlow's homeworld server. The information is required for several reasons: (i) to allow GigaFlow to call home and register itself; (ii) to let us know that your installation is healthy and working; (iii) to update blacklists. All calls home are in cleartext. See System > Licences for more.
- Server ID. This is the unique server ID; it is sent in calls home.
- Proxy address. Leave blank to disable proxy use.
- Proxy port, e.g. 80.
- Proxy user.
- Proxy password.
- Click Test Proxy Settings to test the proxy server.
- Click Save Proxy Settings to save the settings.
Click the fourth icon from the left, above the main tabs, to add a MAC Vendor. To add a new vendor prefix:
- Enter a MAC address.
- Enter the prefix length in octets, i.e. 12 for the full address, 10 leftmost octets, 8 leftmost octets, 6 leftmost octets or 4 leftmost octets.
- Enter the vendor name, e.g. Dell.
- Click Save to save changes.
Existing vendor prefixes are displayed in the table below alongside the date created and available actions, i.e. modify or delete.
If you are using email alerts, you can configure email here. To set up email:
- Change Enabled from No to Yes.
- Enter the email address that GigaFlow will send email from.
- Enter the email address of the user receiving GigaFlow alerts.
- TLS (transport layer security)? Yes or No. See Glossary for more about TLS.
- Enter the mail server username.
- Enter the mail server password.
- Enter the mail server address.
- Enter the mail server port number, e.g. 25.
- Click Test Mail Settings to test the email server.
- Click 'Save Mail Settings to save changes.
Storage Settings
In the Storage settings box, you can make changes to the following settings:
- Monitor Drive Space: enable or disable drive space monitoring, i.e. Yes or No.
- Drive To Monitor: set the drive to monitor, e.g. C:/.
- Min Free Space (GB): set the minimum free space allowed (GB).
- Default Device Storage Space (GB): set the default device storage space (GB).
- Min Forensics Storage (Days): set the minimum forensics storage (Days), e.g. 21. After this time, flowsec records will be deleted.
- Requires 720 MB or 15 per hour.
- See Disk Usage by Device', below.
- Max Forensics Storage (Days):
- Cannot determine how many tables may be generated as value =0.
- IP Search Storage (Days): set the IP search storage (Days), e.g. 21. After this time, IP address history will be deleted.
- Forensics Storage Threads:
- Forensics Table Cache Size: set the forensics table cache size, e.g. 10,000. This is the number of entries cached before writing to disk.
- Forensics Table Cache Age (ms): set the forensic table cache age (milliseconds), e.g. 10,000. After 10 seconds, the forensic data is written to disk.
- Forensics Cache Storage: set the forensic cache storage size, e.g. 40,000.
- Forensics Indexes: enter forensics indexes. This is a comma-delimited list of forensics table field names, e.g. "srcadd,dstadd,appid". See Reports > Forensics in the Reference Manual for more.
- Enter forensics indexes
- Forensics Rollup Age (Days): set the forensic rollup age (Days), e.g. 4 days, period after which data should be rolled into daily tables.
- Forensics Rollup Location: set the forensics rollup location.
- Event Storage Period (Days): set the event storage period (Days), e.g. 100 days, how long events should be recorded for.
- ARP Storage Period (Days): set the ARP storage period (Days), e.g. 100 days, how long ARP entries should be recorded for.
- CAM Storage Period (Days): set the CAM storage period (Days), e.g. 100 days, how long ARP entries should be recorded for.
- Event Summary Storage Period (Days): set the event summary storage period (Days), e.g. 200 days.
- Interface Summary Storage Period (Days): set the interface summary storage period (Days), e.g. 200 days.
- DB Fetch Size:
- Allow Unlogged flow tables:
- Auto-tune PostgreSQL: enable or disable Auto Tune of the Postgres database. Yes or No.
- Archive Folder Location:
- Enter Archive Folder Location
- Archiving Enabled :
- TCP Syslog Threads:*
- TCP Syslog Buffer Size*
To commit changes, click Save Storage Settings.
Disk Usage by Device
The following information is given for each flow device:
Netflow
- Device: device name.
- Largest Time: date and hour.
- File Window: hours.
- Total MB.
- % of All.
- Average File MB.
- Average Per Day MB.
- Largest Size.
The minimum Forensics Storage is 21 days. Forensics data is stored in tables for up to four hours to speed up search and reporting. These tables are rolled into one-day tables after the Forensics Rollup Age period; this is four days by default. (see System > Global.) This is a minimum period.
It is important to set aside space for drive monitoring. GigaFlow will fill the disk drives until the pre-defined minimum amount of free space is left. GigaFlow caps the storage that any particular device is using for forensics data; this is 50 GB by default. This cap can be changed globally and on a per device basis which in turn sets an overall cap on the amount of space used by GigaFlow.
Data Retention and Rollup| Type | Resolution | Table Duration (default) | Retention | Setting Involved |
|---|
| Raw Flows | millisecond | 1 hour-1 day | 21 days | Min Free Space, Default Device Storage Space, Min Forensics Storage, Forensics Rollup Age. |
| IP Search | millisecond | 1 day | 21 days | IP Search Duration. |
| Events | millisecond | 4 hour | 100 days | Event Storage Period, Event Summary Storage Period. |
| ARP | millisecond | 1 day | 100 days | ARP Storage Period. |
| CAM | millisecond | 1 day | 100 days | CAM Storage Period. |
| Interface Summaries | Minute | 2 day | 200 days | Interface Summary Storage Period. |
| Traffic Summaries | Hour | 7 day | 200 days | Interface Summary Storage Period. |
An integration allows you to call defined external web pages or scripts directly from the Device Interface Overview page. To add an integration, navigate to System > Global. In the Integrations settings box, you can add or change an integration.
There are two types of integration:
- Device: where you can pass the device IP address.
- Interface: where you can pass the device IP address and the ifIndex of the interface being used.
To add an integration:
- Click on the Add Integration icon, fifth from left at the top of the page.
- Enter a new name, e.g. "Interface Action 1".
- Select the type of target, i.e. a device or an interface. These map to the IP address of the device and the ifIndex of the interface.
- Select the type of action, i.e. will the integration work with a web page or a script.
- Enter the web page URL or select a script.
- Enter inputs to be passed via the website or script.
- Click Save to save changes.
Example 1
In the code below, the populated field tells the software that you want to populate the device field with the IP address and the ifindex field with the ifindex. These fields (device and ifindex) will be passed to the target. We also have required fields, which are fields which the user is required to populate.
{'populated':{'device':'flow_device','ifindex':'flow_ifindex'}, 'required':[{'name':'user','display':,'type':'text','value':},{'name':'password','display':'Password','type':'password'},{'name':'macro','display':'What Macro?','type':'select','data':['macro1','macro2','macro3','macro4']}]}
Example 2:
var ProcessBuilder = Java.type('java.lang.ProcessBuilder');var BufferedReader = Java.type('java.io.BufferedReader');var InputStreamReader= Java.type('java.io.InputStreamReader');output.append(data);output.append("Device IP:"+data.get("device")+"");output.append("IFIndex:"+data.get("ifindex")+""); try { // Use a ProcessBuilder //var pb = new ProcessBuilder("ls","-lrt","/"); //linux var pb = new ProcessBuilder("cmd.exe", "/C", "dir"); //windows output.append("Command Run"); var p = pb.start(); var is = p.getInputStream(); var br = new BufferedReader(new InputStreamReader(is)); var line = null; while ((line = br.readLine()) != null) { output.append(line+""); } var r = p.waitFor(); // Let the process finish. if (r == 0) { // No error // run cmd2. } output.append("All Done"); } catch ( e) { output.append(e.printStackTrace()); } log.warn("end")Click the Add Observer GigaStor icon; this is the last icon at the top of the page. Then enter:
- Display Name:
- URL:
- User:
- Password:
And click Save.
Located at System > Licenses.
Here you can view all the licences associated with GigaFlow.
The GigaFlow License table lists:
- This Server ID.
- First run, date and time.
- Customer name.
- Product name.
- Expiration date of license.
- Duration of license.
- Number of flow devices.
- Number of flows per second.
- You can enter a new license in the text box at the end of this table. Click ADD to submit.
The license is also viewable as a JSON object at the bottom of the page.
All 3rd party licenses are listed in the next table. These are:
All communications between your installation of GigaFlow and our servers are carried out in cleartext over HTTP; you have complete visibilty. You can view call home data at System > Licenses.
All communications between your installation of GigaFlow and our servers are carried out in cleartext; you have complete visibilty. You can view call home data at System > Licenses.
A typical response to a call home might look like. You can view call home response data at System > Licenses.
You can view all call home errors at System > Licenses.
JSON object version of GigaFlow license.
Add Port and Netflow Processing Threads links at top of page.
Located at System > Receivers.
Here you can view and edit GigaFlow's defined Netflow receivers.
It is important to ensure that the installation is ready to listen. Senders on your network will be configured to send to the GigaFlow server address and to a defined port; these must match the receivers.
GigaFlow is built to receive and process flow records and session-based syslogs. GigaFlow can also process syslog messages relating to specific user or IP authentication details.
Flow records are processed automatically into the flow databases. The records are also checked against blacklisted IPs and against defined Profilers. See System > Blacklists and Profiling.
The syslog messages are sent to the syslog processor for parsing.
Here you can see the existing listener ports available and if they are receiving flows or syslogs.
You can select the number of ports to show from the dropdown menu above the table, i.e. 10, 25, 50, 100 or all. The default is 50 items. The total number of ports is displayed at the top of the table. The information displayed includes:
- Port number.
- Port type.
- Any associated settings.
- Minimum, maximum and average number of packets.
- Status, i.e. running, yes or no.
- Action: delete
 or stop
  Stop icon..
To add a new port, click the + icon at the top of the page. Then:
- Enter the new port number.
- Enter the new port type.
- Enter the new port source mask. This mask is applied to the IP address of the source device. It can be useful to consolidate multiple flow senders into virtual source device(s). Leave blank for no summarization.
- Click Save to create and save.
To edit the number of Netflow processing threads, enter the new number and click Save.
The Port Threads table displays summary information about the port threads. This includes:
- Port number.
- Type, e.g. V5, V9.
- Thread.
- Devices.
- Received packets.
- Dropped packets.
- Current packets.
- Ignored packets.
- Max packets.
Infrastructure visibility is achieved using session-based Syslog. Located at System > Syslog Parsers.
System log parsing rules can be viewed and edited here.
All existing syslog parser patterns are listed here. Information displayed includes:
- ID.
- Name.
- Description.
- Type.
- Fields.
- Actions, e.g. edit or delete.
Default system Syslog parser patterns are listed here. Information displayed includes:
- ID.
- Name.
- Description.
- Hits.
- Misses.
- Took.
- Actions, e.g. edit or delete.
Click + to add the corresponding Syslog parser from the drop-down menu.
System Syslog exceptions are listed here. Information displayed includes:
- Time.
- Source IP.
- Data about the exception.
Located at System > System Health.Here you can find timelines of:
- DNS cache size.
- All users size.
- Users-to-IP size.
- Forward event codes size.
- forward extended codes size.
- Deduplication size.
- Free swap space size.
- Total physical memory size.
- Total used Java memory size.
- Committed virtual memory size.
- Free physical memory size.
- Total swap space size.
- Total vs. free memory size.
- Total used Java memory size.
- CPU load.
- Flows per second.
- Receiver drops.
- Receiver ignored.
- Free disk space.
- Connected device stops sending flows (remove?).
Located at System > System Status.
- Limit: 25 is the default number of items to show. Other options are None, 10, 25, 50, 100, 200, 500 and 1,000.
- Refresh: 5 seconds is the default refresh time. Other options are Never, 1 second, 5 seconds, 10 seconds, 30 seconds and 1 minute.
- You can enter a regular expression to filter log entries.
- Click Submit to update the log file viewer settings.
This page displays memory performance. The start time and uptime are displayed prominently at the top of the page.
The main table lists:
- IPs, active and total.
- IP window, e.g. 0 seconds.
- Used memory (bytes).
- Total memory (MB).
- Number of devices.
- Number of MACs.
- Maximum memory (MB).
- Percent memory used.
- Free memory (MB).
- Number of MACs For Prefix 6. Click List to list them.
- Number of MACs For Prefix 7. Click List to list them.
- Number of MACs For Prefix 9. Click List to list them.
- Number of MACs For Prefix 12. Click List to list them.
- You can go to relevant sections of the Log Viewer and to First Packet Response by clicking the links below. See System > System Status and Configuration > Server Subnets for more.
The Stats sections details:
- Number of devices.
- Latest flows per second.
- Average flows per second.
- Kafka Enabled: Yes or No.
- Syslog Forensics Enabled: Yes or No.
- Server Discovery: default, Server Discovery by Device. Click to open a new table.
- Syslog Forensics Flows: default, Syslog Forensics Flows. Click to open a new table.
- PENs: click to refresh.
- DNS cache: click to delete.
- Users seen.
- Users seen to IP address.
- Event codes.
- Ext codes.
- App IDs.
- De-duplication codes.
- Syn sources reports.
- Syn destinations reports.
- Loaded Netflow archives.
- Netflow tables.
- Oldest Netflow data.
- Oldest Netflow device.
- Oldest Netflow realtime.
- FlowSec tables.
- Oldest flowsec data.
- Oldest event summary.
- MB per day for forensics.
- MB per day for flowsec.
- Largest tables all forensics by device: click to open new table.
This page displays the performance of database connections. The database start time and uptime are displayed prominently at the top of the page.
The DB connections table lists the most recent database connections. See PostgreSQL documentation for more.
Select how many entries to view from the drop-down menu, i.e. the 10, 50, 100 or All. The default selection is 50.
The table lists:
- Database name.
- Client.
- Start time.
- Duration of connection.
- Waiting.
- Process ID.
- Query.
- Action, i.e. Remove.
You can view any PostgreSQL database deadlocks to help with troubleshooting performance problems. See PostgreSQL documentation for more. The table lists:
- The name of database involved.
- The relation involved. This is an internal PostgreSQL object identifier.
- The ID of the transaction targeted by the lock, or null if the target is not a transaction ID.
- The name of the lock mode held or desired by this process.
- If the lock was granted or not: this is true if the lock is held, false if the lock is awaited.
- The user that initiated the transaction.
- The query involved in the transaction.
- The start time of the transaction.
- The age of the transaction.
- The process ID of the server process holding or awaiting this lock, or null if the lock is held by a prepared transaction.
This page displays named table performance. The start time and uptime are displayed prominently at the top of the page. See PostgreSQL documentation for more.
Select how many entries to view from the drop-down menu, i.e. the 10, 50, 100 or All. The default selection is 10. You can also search for specific tables.
This page displays prepared table performance. The start time and uptime are displayed prominently at the top of the page. See PostgreSQL documentation for more.
Select how many entries to view from the drop-down menu, i.e. the 10, 50, 100 or All. The default selection is 10. You can also search for specific tables.
Located at System > Users.
New Add links along top of page.
Here you can view and edit information for all GigaFlow users and user groups. There are three categories of user on GigaFlow:
- Local users; these are users set up for the particular GigaFlow installation.
- LDAP users; these are network users authenticated by LDAP.
- Portal users; these are users identified by a username and IP address. Portal user access is useful for programmatic access to the system, i.e. scripts.
Select how many entries to view from the drop-down menu, i.e. the 10, 50, 100 or All. The default selection is 10. You can also search for specific usernames or IDs using the search box.
All users are listed here. Information displayed includes:
- Name.
- Login ID.
- User type. Local users exist in the local database only. LDAP users were entered locally but authenticated against the LDAP server.
- User specific settings.
- User password.
- Actions, i.e Remove user, Edit user or Change Password.
To add a new local user:
- Enter the email address of the new user. This is the same as the login name.
- Enter a display name for the new user.
- Select a user role from the drop-down menu, e.g. normal or administrator.
- Enter a password for the new user.
- Click Add User to add the new user.
To add a new user group:
- Enter the new user group name.
- Select abilities to associate with the new user group.
- Click Add User Group to add the new user group.
This table lists all existing user groups along with associated abilities.
For each user group:
- Click the small x beside an ability to remove it.
- Select new abilities from the drop-down menu to the right and click Add to add abilities to a user group.
Information displayed includes:
- Name.
- Settings.
- Actions, e.g. Edit user or Remove user.
Enter the domain name and ID of the user you want to allow to log into the system. They will be added as normal users.
To add a new LDAP user:
- Enter the new user ID.
- Enter the new user domain.
- Click Add LDAP User.
To add a new LDAP user group:
- Select a group from the drop-down menu.
- You can also apply a filter to limit number of available groups. Enter filter text and click Apply LDAP Filter. (You can use *filter text* for wild card searches.)
- Select user role, e.g. normal or administrator.
- Click Add LDAP Group to add the new LDAP group.
Information displayed includes:
- Name.
- Settings.
- Actions, e.g. Edit user or Remove user.
- Select how many entries to view from the drop-down menu, i.e. the 10, 50, 100 or All. The default selection is 10. You can also search for specific usernames or IDs using the search box.
Information displayed includes:
- Login ID.
- IP address.
- User name.
- Actions, e.g. Edit user or Remove user.
To add a new portal user:
- Enter the new IP regular expression.
- Enter the new user regular expression.
- Click Add Portal User.
This table lists all of the currently configured Data Access Groups.
For each Data Access Group:
- You can see the number of traffic groups allowed under the entries column.
- Remove the traffic group
- Click Edit to Edit the group.
This function allows you to apply a filter to the data a user requests automatically. These filters are based on Traffic Groups and a user can have access to many Traffic Groups using this feature.
To add a new Data Access Group:
- Enter a unique name for this group.
- Enter a description for this Data Access Group
- Click Add Access Group to add the new Access group.
Once added, you can edit the group to control which Traffic Groups are assigned to it, in the Users own settings you can then assign them to any available Data Access Group.
Located at System > Watchlists.
GigaFlow uses a blacklist compiled from multiple online sources. These lists are retrieved every hour and merged into a list of about 30,000 potentially dangerous IP addresses. Your GigaFlow system checks this hourly-updated list every five minutes and updates the local list when necessary.
We are reviewing our code watchlist terminology and will update this documentation to reflect any changes.
This table lists the online blacklists available with relevant information. Information includes:
- The source URL of the blacklist.
- The size, in number of entries, of this blacklist.
- Confidence level assigned to this blacklist, i.e. your confidence in its completeness and accuracy.
- Severity or importance assigned to this blacklist.
- The date and time of the last update.
- The provider of the blacklist, defaulting to Gigaflow.
- The number of entries.
- The total number of events related to each blacklist.
- You can unsubsribe from any blacklist.
To add a new blacklist source:
- Click the Add Whitelist Source icon, first from left at the top of the page.
- Enter the URL of the new blacklist.
- Enter a display name for the new blacklist.
- Enter the importance (or severity) of the new blacklist.
- Enter your confidence in the new blacklist, i.e. your confidence in its completeness and accuracy.
- Enter a refresh rate in minutes (defaults to 1 minute).
- Click Subscribe to add the new blacklist source.
- Click the Blacklist Actions icon, last from left at the top of the page.
To refresh blacklists automatically, select Yes.
GigaFlow can alert on flow entries that match known bad IP addresses, scanning or outside profiles. Whitelisting provides the facility to tell the checking mechanism in GigaFlow that particular IPs or subnets should not raise an exception on any of the defined conditions. When defining a whitelist you should specify a reason for excluding a host or hosts. If you set the IP address to that of the infrastructure device and the mask to zero, GigaFlow will whitelist all traffic for the device.
The whitelist table shows a list of the current whitelisted items, including the following information:
- Address.
- Mask.
- Entered.
- User.
- Reason.
- Hits, i.e. the number of matched flows to that item.
- Action.
You can select the number of items to show from the dropdown menu above the table; the default is 50 items.
To add a new whitelist entry:
- Click the Add Whitelist Entry icon, second from left at the top of the page.
- Enter IP address of whitelisted site.
- Enter its IP mask.
- Enter a reason for its whitelisting.
- Click Add.
The locally defined blacklist table shows a list of the existing locally-defined blacklists, including the following information:
- The source blacklist.
- The blacklist category.
- The size of the blacklist; this is the number of entries on the list.
- Your confidence in the black list, i.e. your confidence in its completeness and accuracy.
- The importance (or severity) of the blacklist.
- The provider of the blacklist.
- Entries.
- Action.
To add a new local blacklist:
- Click the Add Local Blacklist icon, third from left at the top of the page.
- Enter a category, or name, for the blacklist.
- Enter the importance (or severity) of the new local blacklist.
- Enter your confidence in the new local blacklist, i.e. your confidence in its completeness and accuracy.
- Click Subscribe to add the new local blacklist.
- After submitting the local blacklist, enter IP addresses, separated by a comma or on a new line in the Entries text area and click Save.
Adding a noproxy=true flag to a watchlist URL allows the system to bypass proxy servers and access the list directly, i.e.
{URL to file}?NOPROXY=true