Documentation >
How-To Guide for GigaFlow GigaFlow requires Oracle Java 1.8 and PostgreSQL 9.4 or above.
The recommended platform for GigaFlow is Windows Server 2008+ 64 bit, English Edition. Installation must be performed using a local administrator account, not a domain administrator account.
GigaFlow will install:
- Oracle Java 1.8.
- PostgreSQL 9.5.
- The Gigaflow Service.
When complete, a new service called GigaFlow will be running and enabled when the server starts up. On running the GigaFlow installer, the installation proceeds as follows:
1. This is the GigaFlow Setup welcome page:
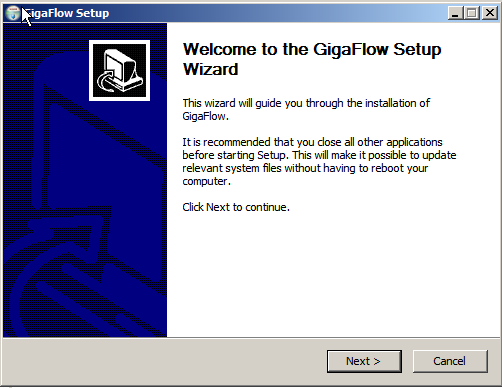
Click Next to continue.
2. On the next page, you can choose whether or not to install start menu shortcuts:
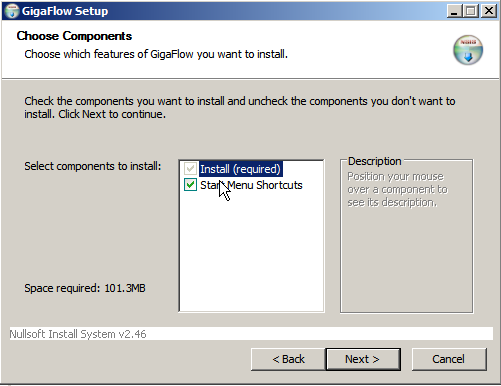
Click Next to continue.
3. The next page displays the GigaFlow End User License Agreement (EULA); you must agree to the terms of the EULA to continue the installation or to use the product.
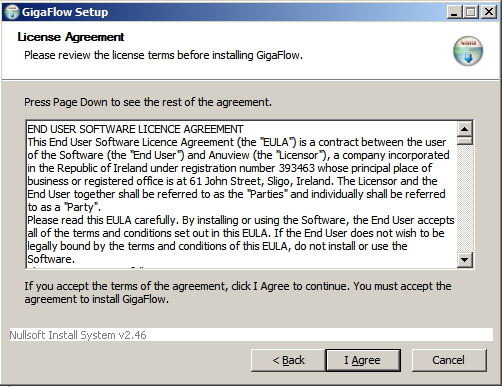
Click I Agree to continue.
4. On the next page, you are reminded of the system requirements for GigaFlow:

Click OK to continue.
5. After accepting the license agreement and acknowledging the reminder, you can define:
- The ports that GigaFlow will listen on for the product UI.
- How much RAM the product can use. This does not include PostgreSQL requirements.
- The location of the GigaFlow database. The path name must not include spaces.
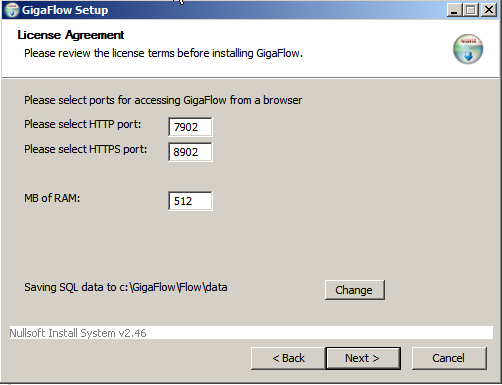
Click Next to continue.
5. Select a location for the GigaFlow application files. Again, the path name must not include spaces.
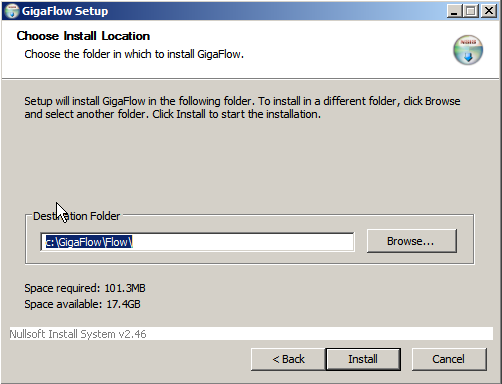
Click Install to continue.
6. When the installation is complete, you can click Show Details to see what the installer did.

Click Next to continue.
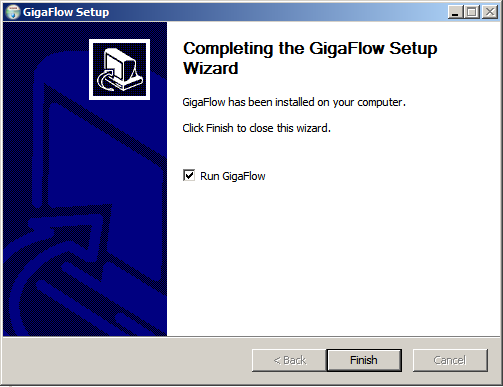
6. The installation is now finished. With the Run GigaFlow tick box checked, the installer will open the GigaFlow User Interface in your default browser when you click Finish.
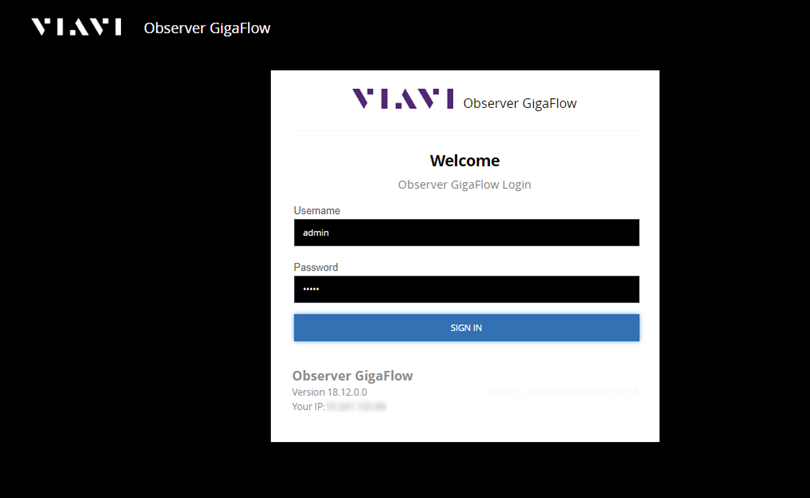
7. Your browser will open at the GigaFlow login page. The default credentials are:
- Username: admin
- Password: admin
Below the login panel, you can see your GigaFlow installation version details.

7. Logging in for the first time, you will be prompted for some information:
- Server Name is your name for this server. It does not have to be the same as the server hostname. The Server Name will appear in the web browser title bar.
- Minimum Free Space is the minimum free space that you want to maintain on disk before purging old data. This is typically 10% of your total disk space.

You are ready to use GigaFlow.
See the GigaFlow Wiki for further installation notes.
Logging In
Figure: GigaFlow's login screen
- Go to gigaflow.viavi.com from any browser.
- Log in using your credentials.
- GigaFlow will open on the Dashboards welcome screen.
See Login in the Reference Manual.
Give the Server a Name
After logging in for the first time, you will see:
You have not yet configured your server name, please do so below. This does not have to be the hostname.
Enter a name for your GigaFlow server. This will be used in the title bar and when making calls back to the Viavi home server.
See System > Global in the Reference Manual for more. You can change the server name at any time by navigating to System > Global.
Assign Disk Space
After logging in for the first time, you will also see:
Please select how much free space to keep on disk before forensic data is aged out.
This is the minimum free space to maintain on your disk before forensic data is overwritten. The default value is 20 GB.
Enter a value and click Save.
See also System > Global in the Reference Manual for more. You can change the storage settings at any time by navigating to System > Global > Storage.
Enable Call Home Functionality
Enable GigaFlow's call home functionality by configuring the proxy server, if one exists, at System > Global> Proxy. This information is required for several reasons: (i) to allow GigaFlow to call home and register itself; (ii) to let us know that your installation is healthy and working; (iii) to update blacklists. All calls home are in cleartext. See System > Licences for more. The required information is:
- Server ID. This is the unique server ID; it is sent in calls home.
- Proxy address. Leave blank to disable proxy use.
- Proxy port, e.g. 80.
- Proxy user.
- Proxy password.
- Click ? to test the proxy server.
- Click Save
 .
.
See also System > Global in the Reference Manual for more.
Install License
You must enter a valid license key to use GigaFlow. Enter your license key in the text box at the end of the table at System > Licenses. Click ADD to submit.
See also System > Licenses in the Reference Manual.
Enable Blacklists
To begin monitoring events on your network, subscribe to one or more blacklists at System > Watchlists.
See also System > Watchlists in the Reference Manual.
Enable SNMP
To poll your network infrastructure devices, you must provide GigaFlow with SNMP community strings and authentication details. You can do this at System > Global.
SNMP V2 Settings
Enter the community name in the text box and click Save.
SNMP V3 Settings
- Enter the new SNMP V3 community name.
- Enter a user name.
- Auth Type, i.e. MD5 or SHA secure hash functions.
- Enter an authentication type password.
- Privacy Type, i.e. AES-128, AES -198, AES-256, DES or 3DES.
- Enter a privacy password.
- Enter a context. SNMP contexts provide VPN users with a secure way of accessing MIB data. See Cisco and the Glossary for more.
- Submit by clicking Save.
See also System > Global in the Reference Manual.
Enable and Test First Packet Response
First Packet Response (FPR) is a useful diagnostic tool, allowing you to compare the difference between the first packet time-stamp of a request flow and the first packet time-stamp of the corresponding response flow from a server. By comparing the FPR of a transaction with historical data, you can troubleshoot unusual application performance.
To begin using First Packet Response, you must specify the server subnets that you would like to monitor. Navigate to Configuration > Server Subnets.
Select the Server Subnets tab and enter a server subnet of interest. To add a new server subnet:
- Enter the subnet address.
- Enter the subnet mask.
- Click Add Server Subnet.
- Click Cancel to clear the data entered.
By clicking on the Servers tab, you can view a list of the identified servers that will be monitored. You can see a realtime display of the First Packet Response by clicking to enable the ticker beside each server.
By clicking on the Devices tab, you can view a list of infrastructure devices - routers - associated with the server subnets of interest.
Reports for all active monitored servers can be viewed at Reports > First Packet Response.
See also Use First Packet Response to Understand Application Behaviour in the How-to section and Configuration > Server Subnets and Reports > First Packet Response in the Reference Manual for more.
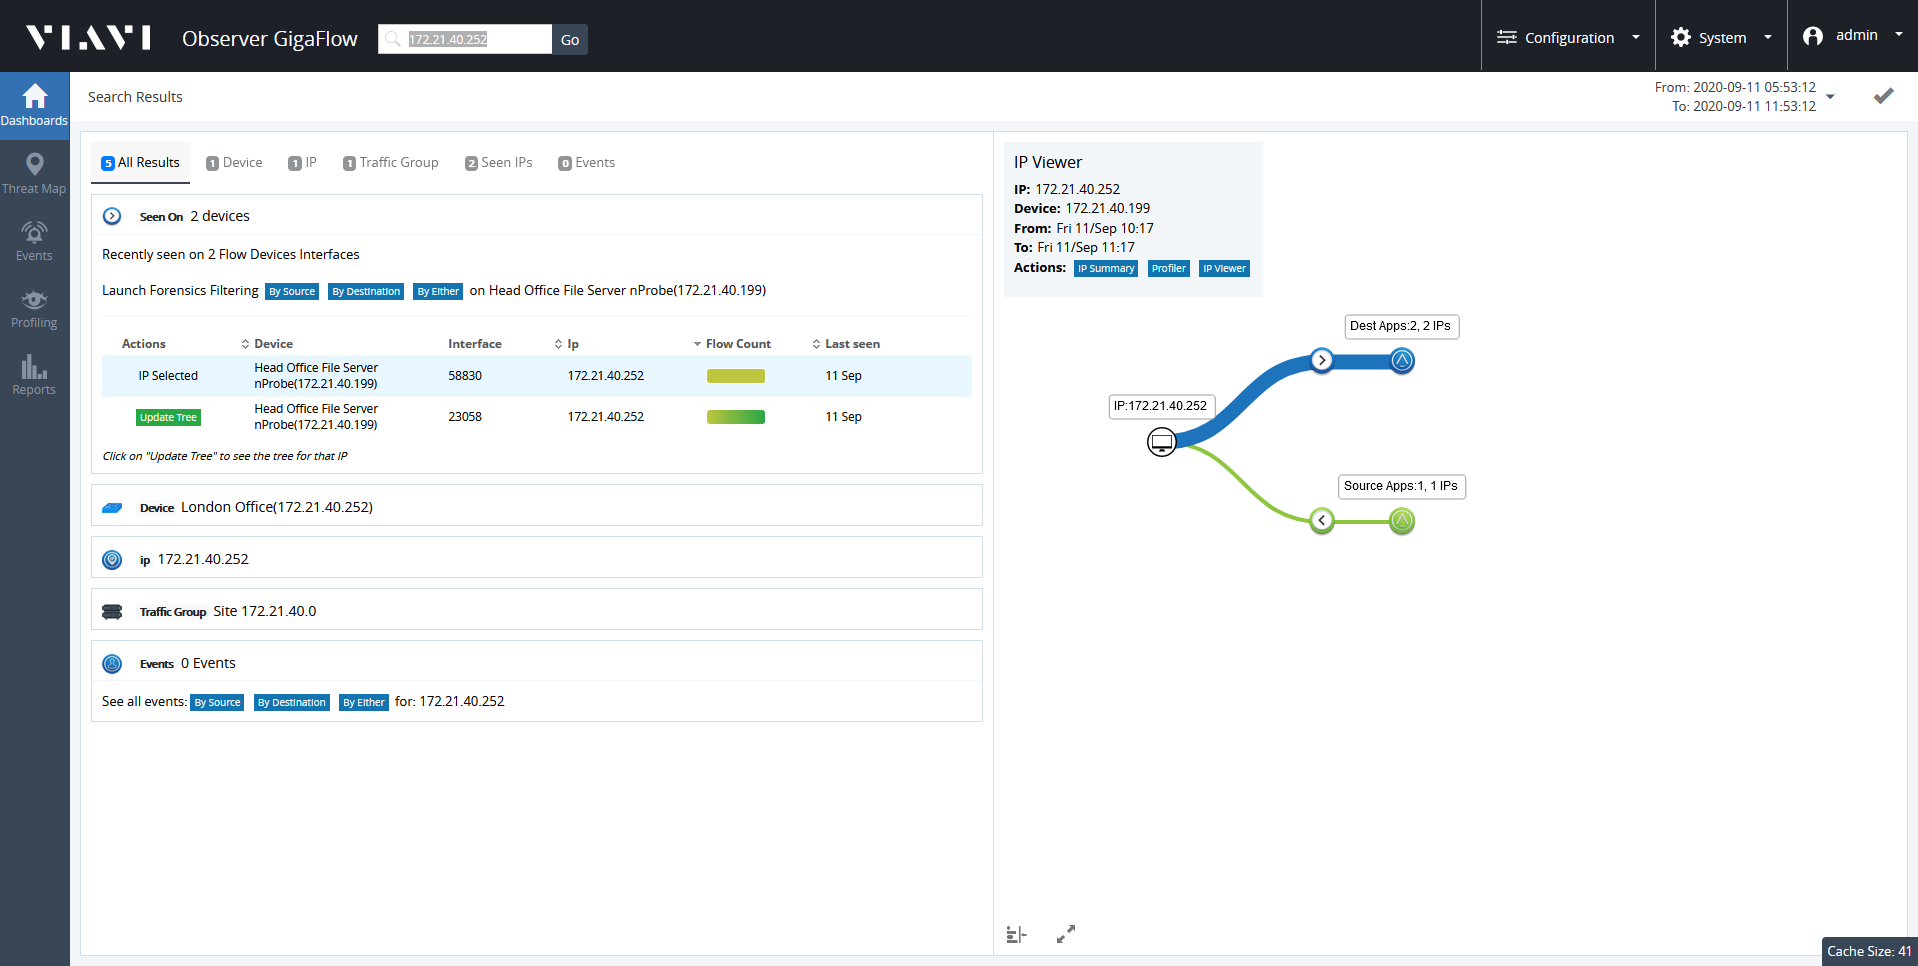
To find out more about a particular IP address:
- Enter an IP address in the main GigaFlow Search box at the top of the screen.
- Click Go.
- Select a reporting period and click Submit .
Click on Events tab in the panel on the left side of the screen.
The infographics and tables display all the security events associated with that IP address during the reporting period.
See Search and Events in the Reference Manual for more.
See Reports > System Wide Reports > Device Connections and Reports > System Wide Reports > MAC Address Vendors in the Reference Manual to find out get a list of MAC addresses associated with your network.
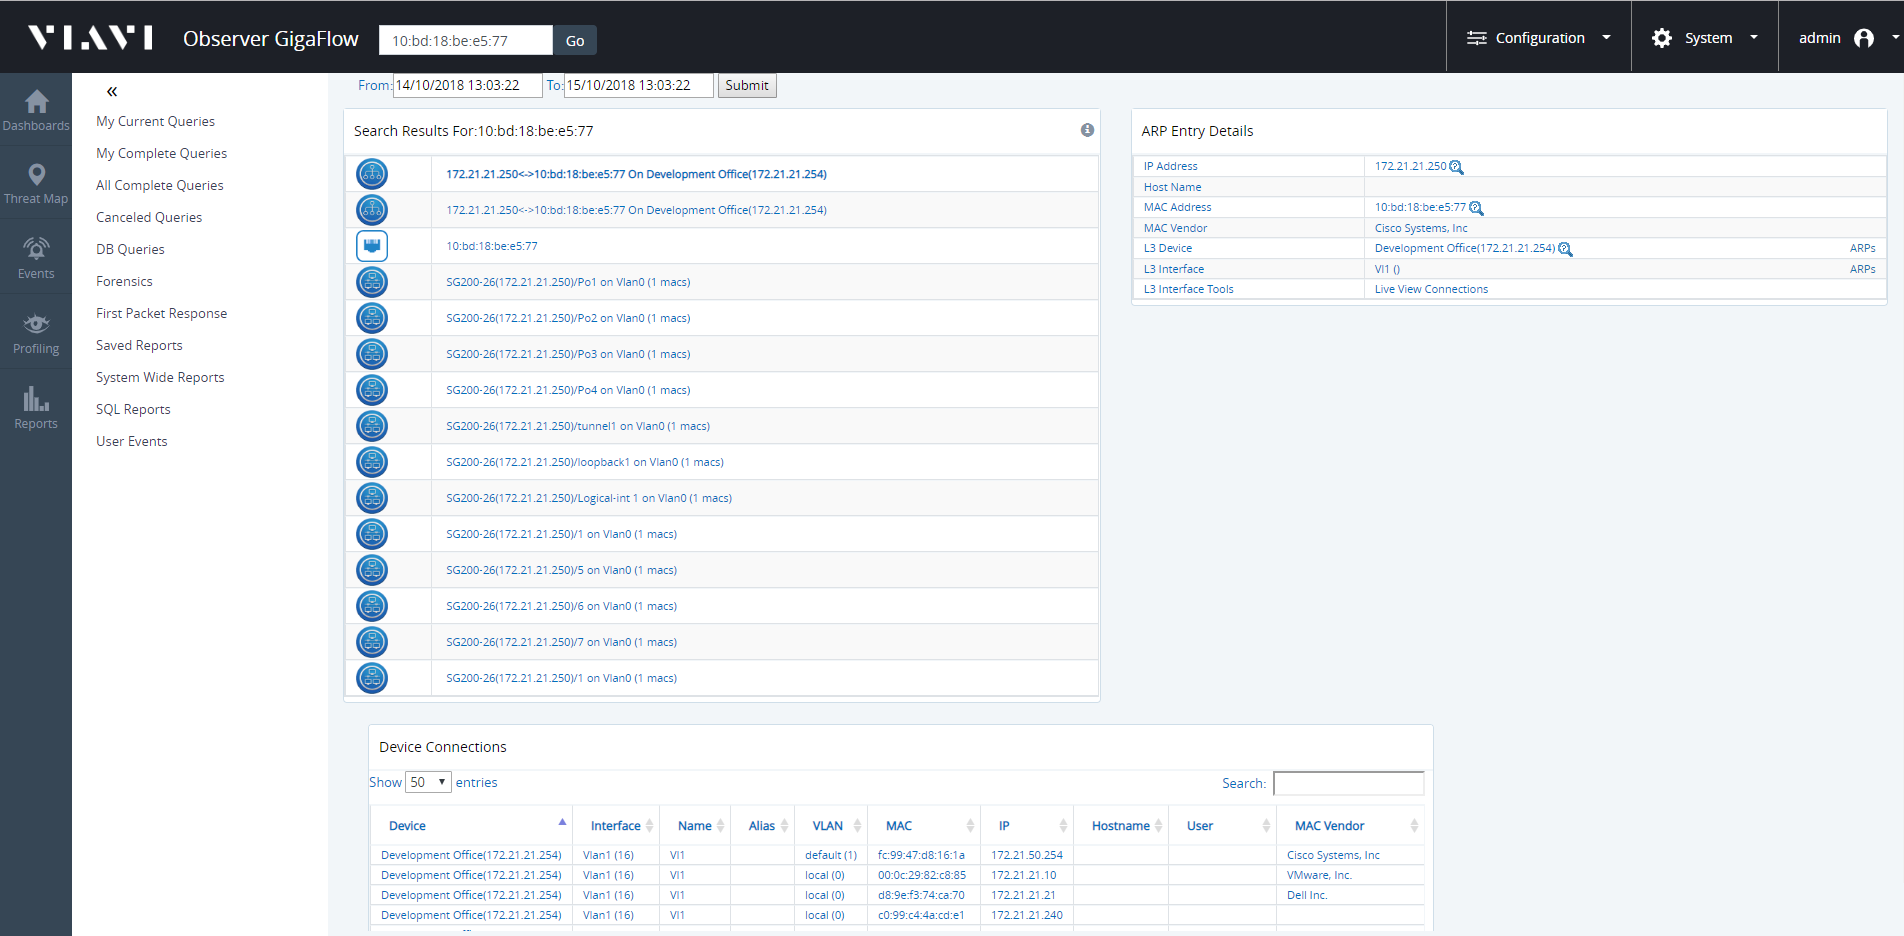
Search for a MAC Address
See Search in the Reference Manual for more.
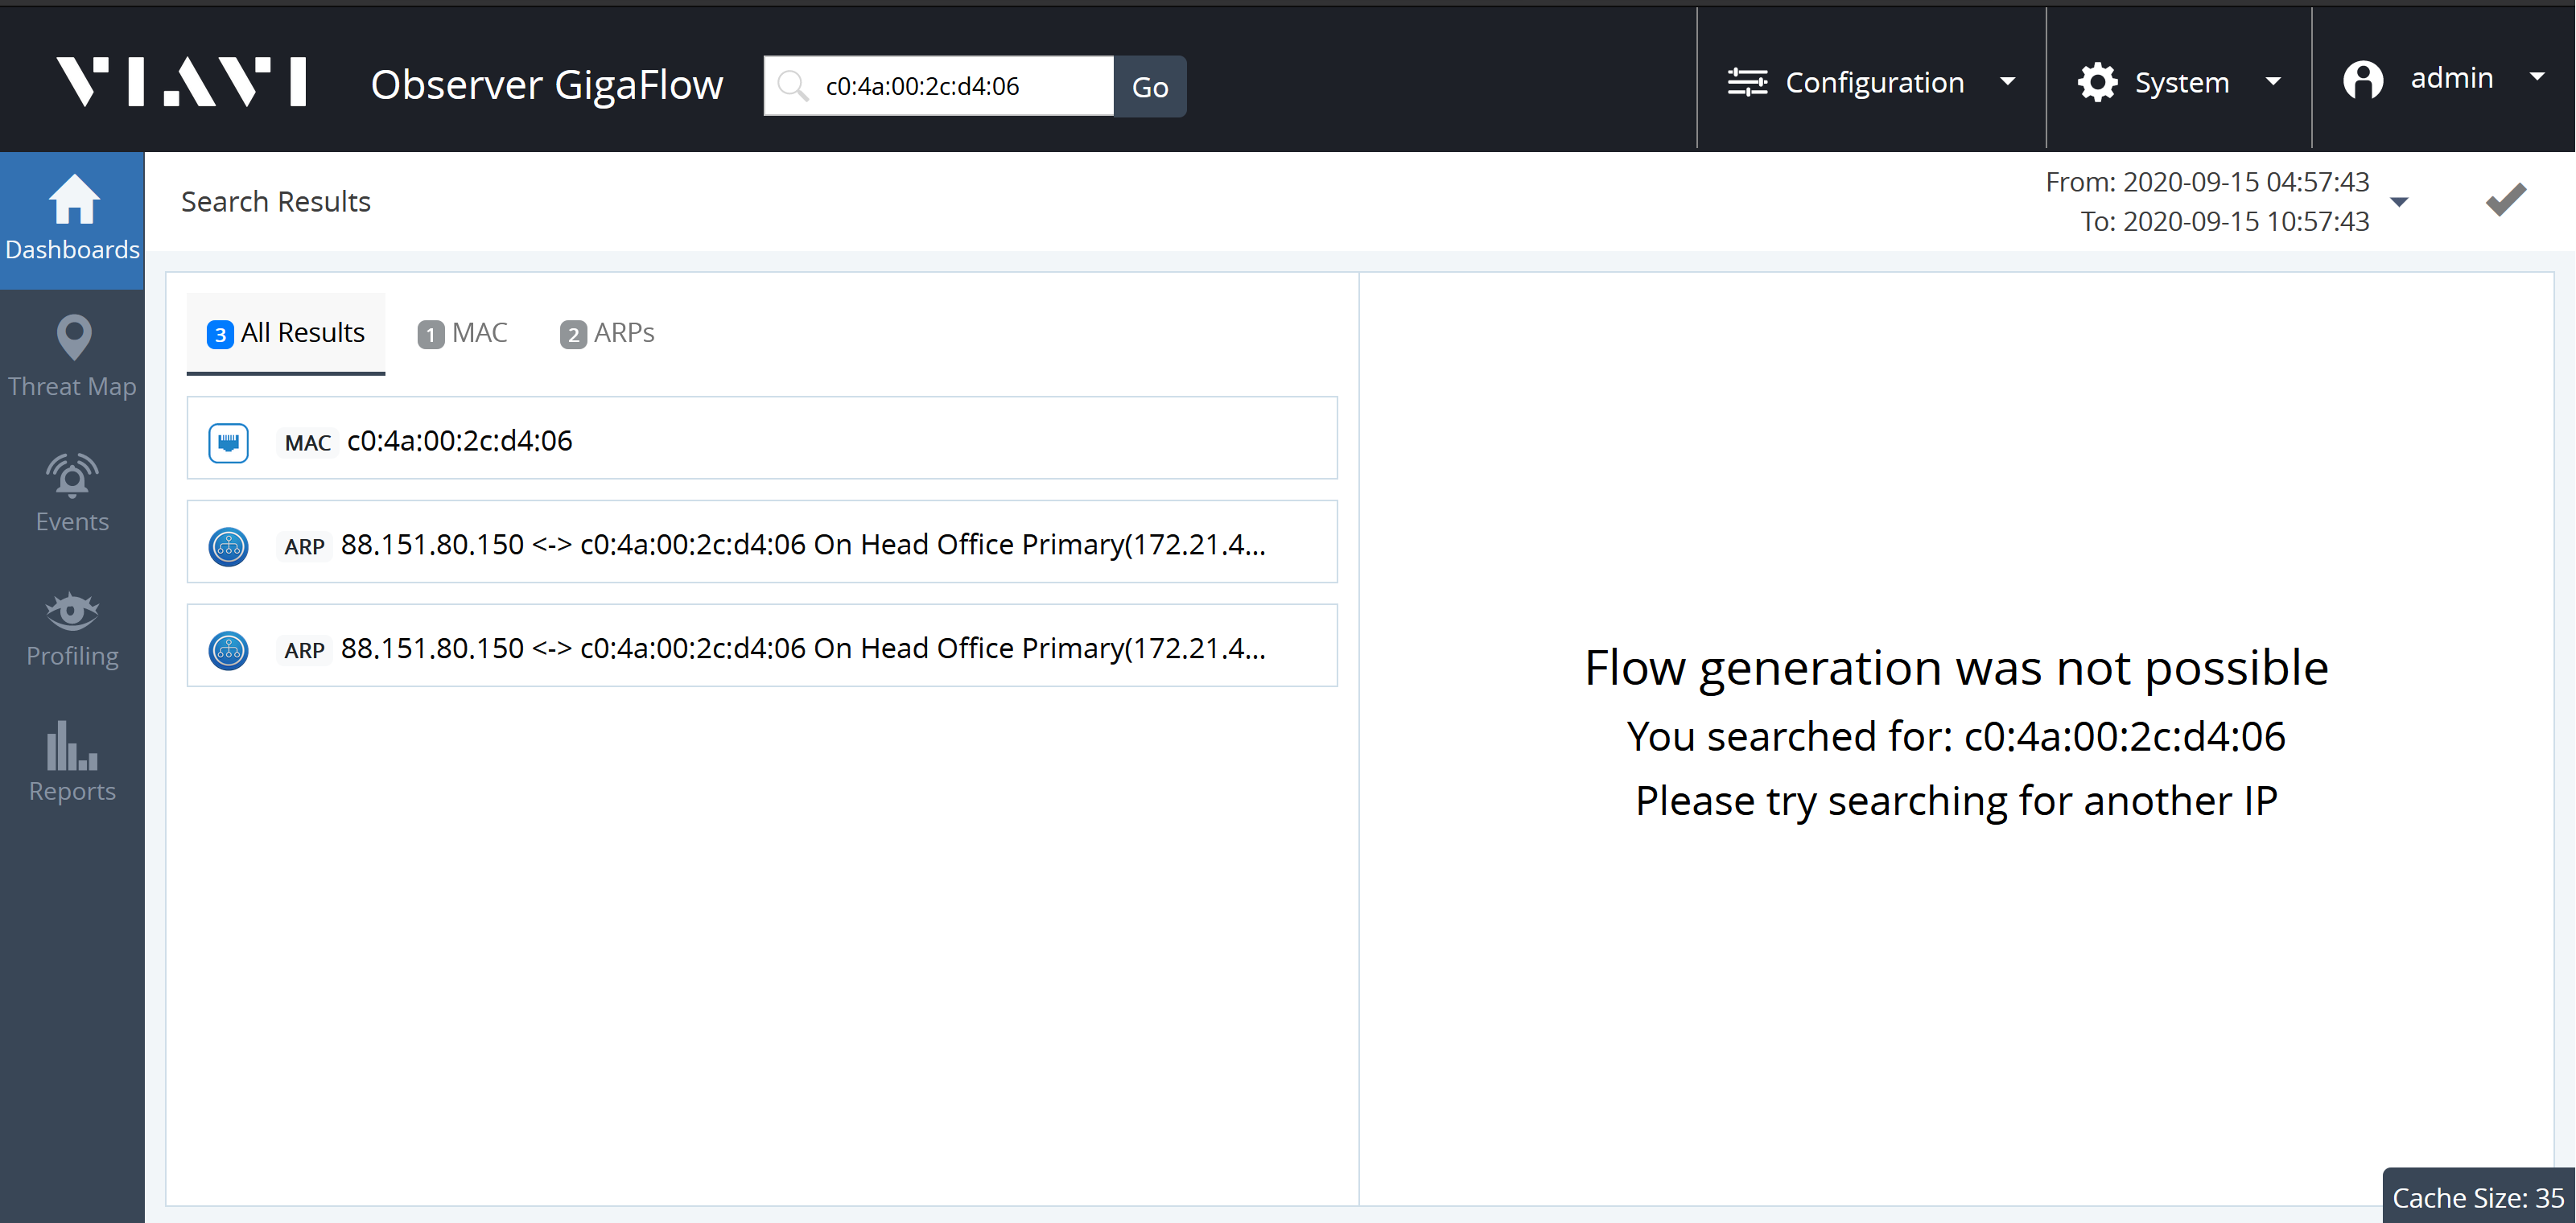
Search for a MAC address to see what device it is connected to and the VLAN it is in:
- Enter the entire MAC address into the search box.
- You must enter the full address.
- GigaFlow's MAC address search works for any standard MAC address format.
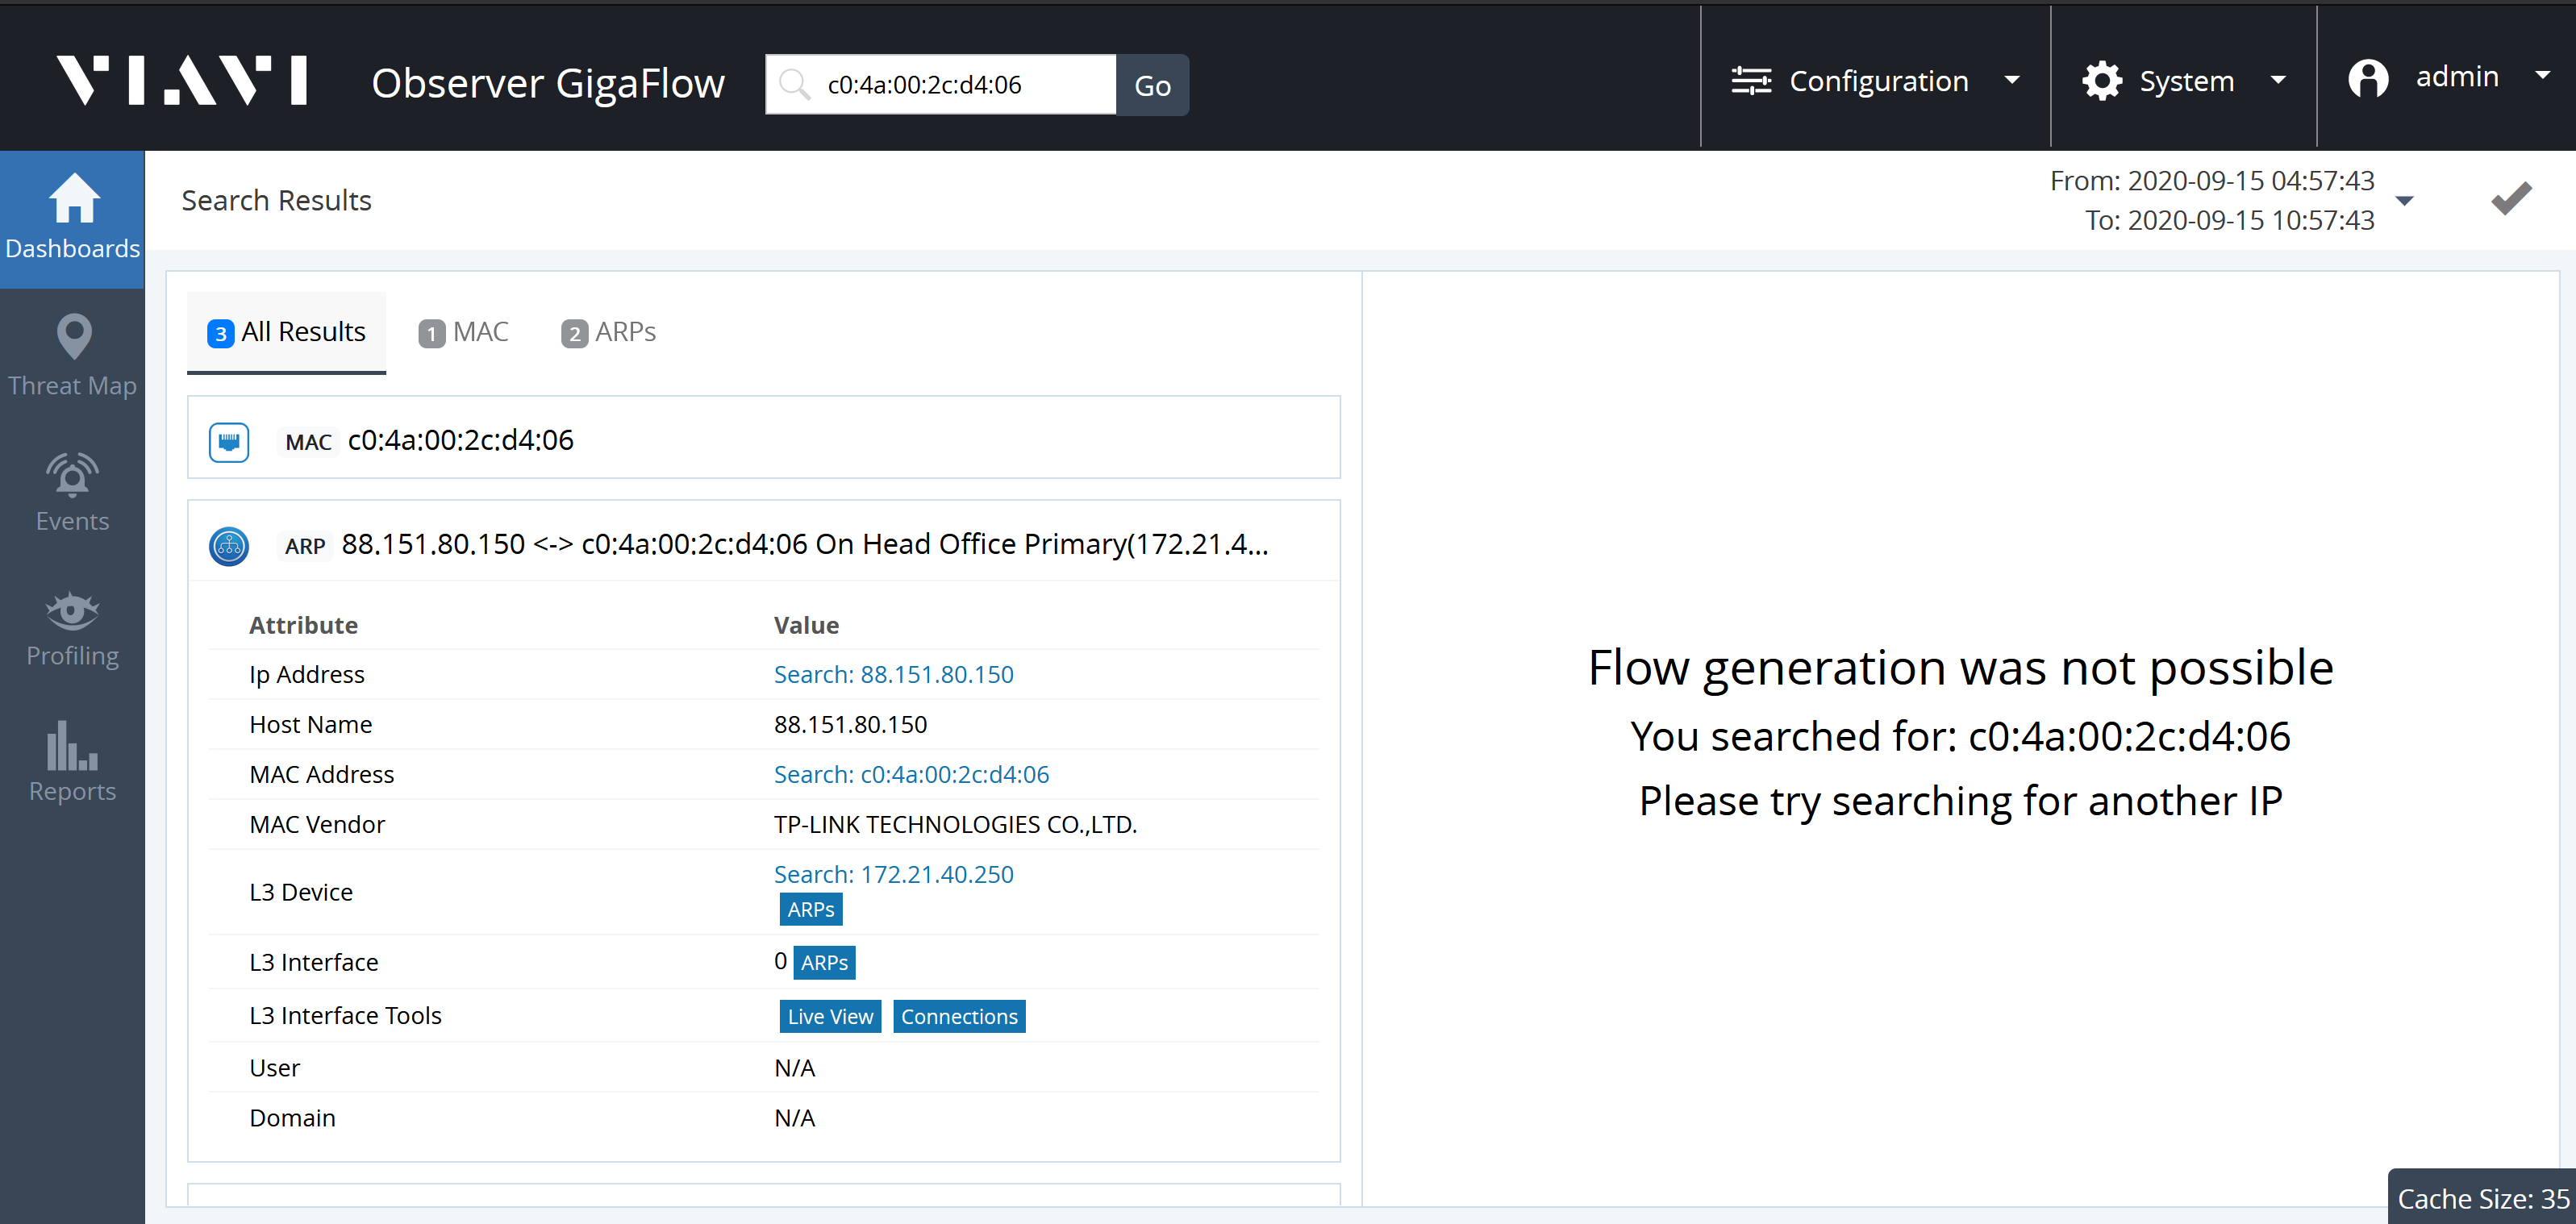
For example, searching for the MAC address c0:4a:00:2c:d4:06 on our demo network:
Expanding the MAC panel displays information:
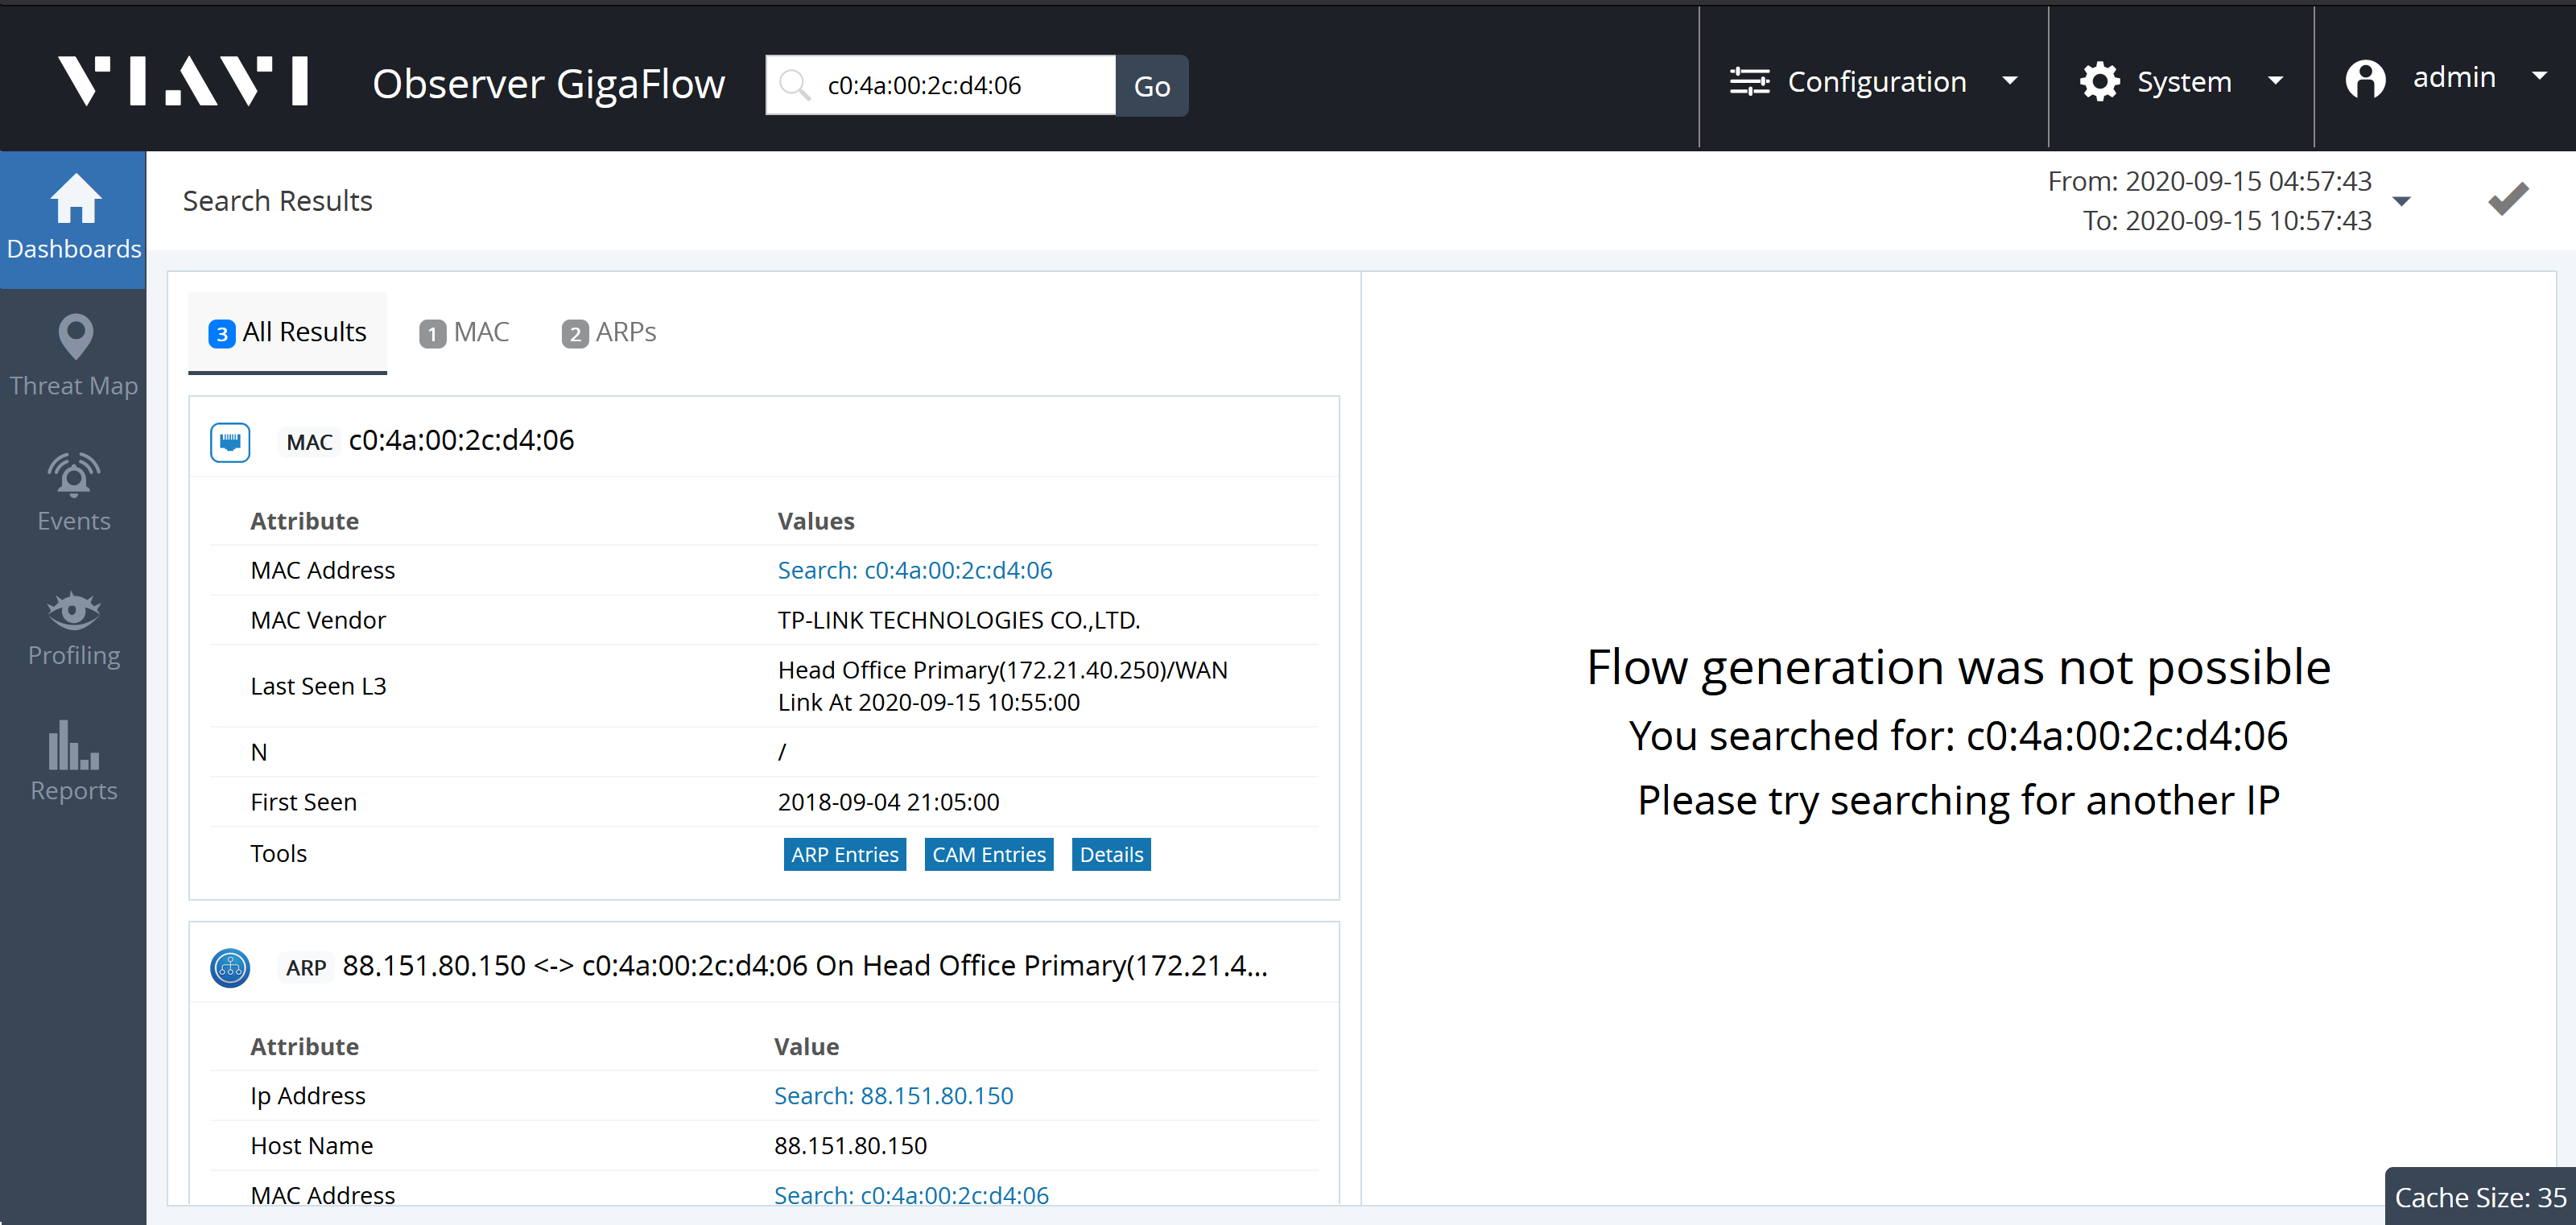
- MAC Address.
- MAC Vendor.
- Last Seen L3: Last seen on which Layer-3 device.
- N: .
- First Seen: date and time first seen on network.
- Tools: ARP Entries, CAM Entries, Details.
Selecting ARPs from the links in Tools brings up the relevant ARP entries. From here, you can click an interface to access more information about the physical interface the device is connected to. The interface with the lowest MAC count is the connected interface.
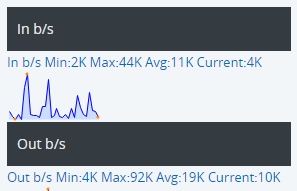
- Click Live Interface in the expanded ARPs panel to view the live in- and out- utilisation of the interface.
- Live View also provides speed, duplex and error count information for the interface.
- Click on Connections in the ARPs panel to see what other devices are connected to the same port.
Blue boxed text indicates any piece of information that allows you to conduct a follow-on search:
- Click on the IP address follow-on search to find out if that address has been seen by any flow devices recently. The IP address search also shows any recent associated secflow data or events, i.e. blacklisted IP addresses and so on.
- Click on the MAC address follow-on search link to find out where the device is physically connected.
The Treeview, or Graphical Flow Map, will automatically load. This is a visual representation of the in- and out- traffic associated with a selected device.
To explore the Graphical Flow Map:
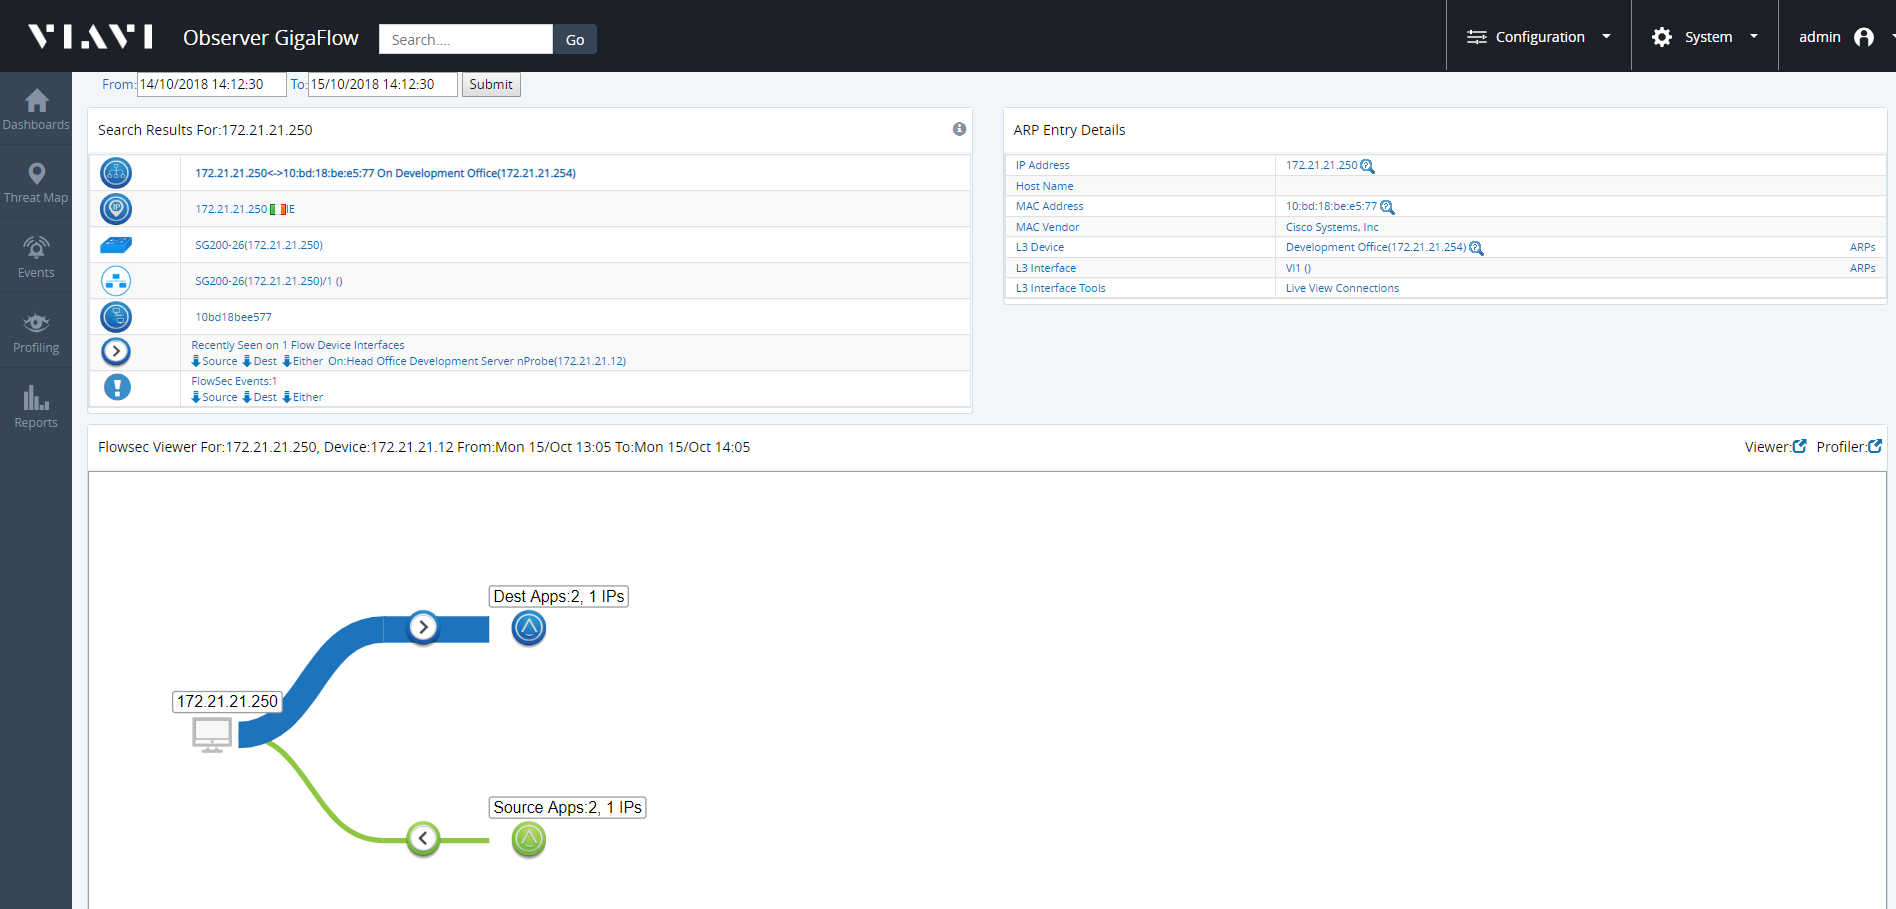
- Click on any icon to show more information.
- Click on the Destination Apps icon or the Source Apps icon for a breakdown of the applications. You can click on these to expand the tree.
- Move the pointer over icons to display the DNS Information of each device, showing how much traffic has been used.
- Click + to see more devices in a tree of many branches.
- The size of the line linking any two devices is proportional to the traffic volume between them.
- Click on any line in the Treeview table to filter only inbound or only outbound traffic. This will open a report showing traffic for the past two hours.
- Enter a username, or part of a username, into the search box.
- GigaFlow will tell you if that username, or any variation of it, has been seen on your network.
- Click on any of the search results to display its associated information in the right-hand side panel.
- Click the associated IP address.
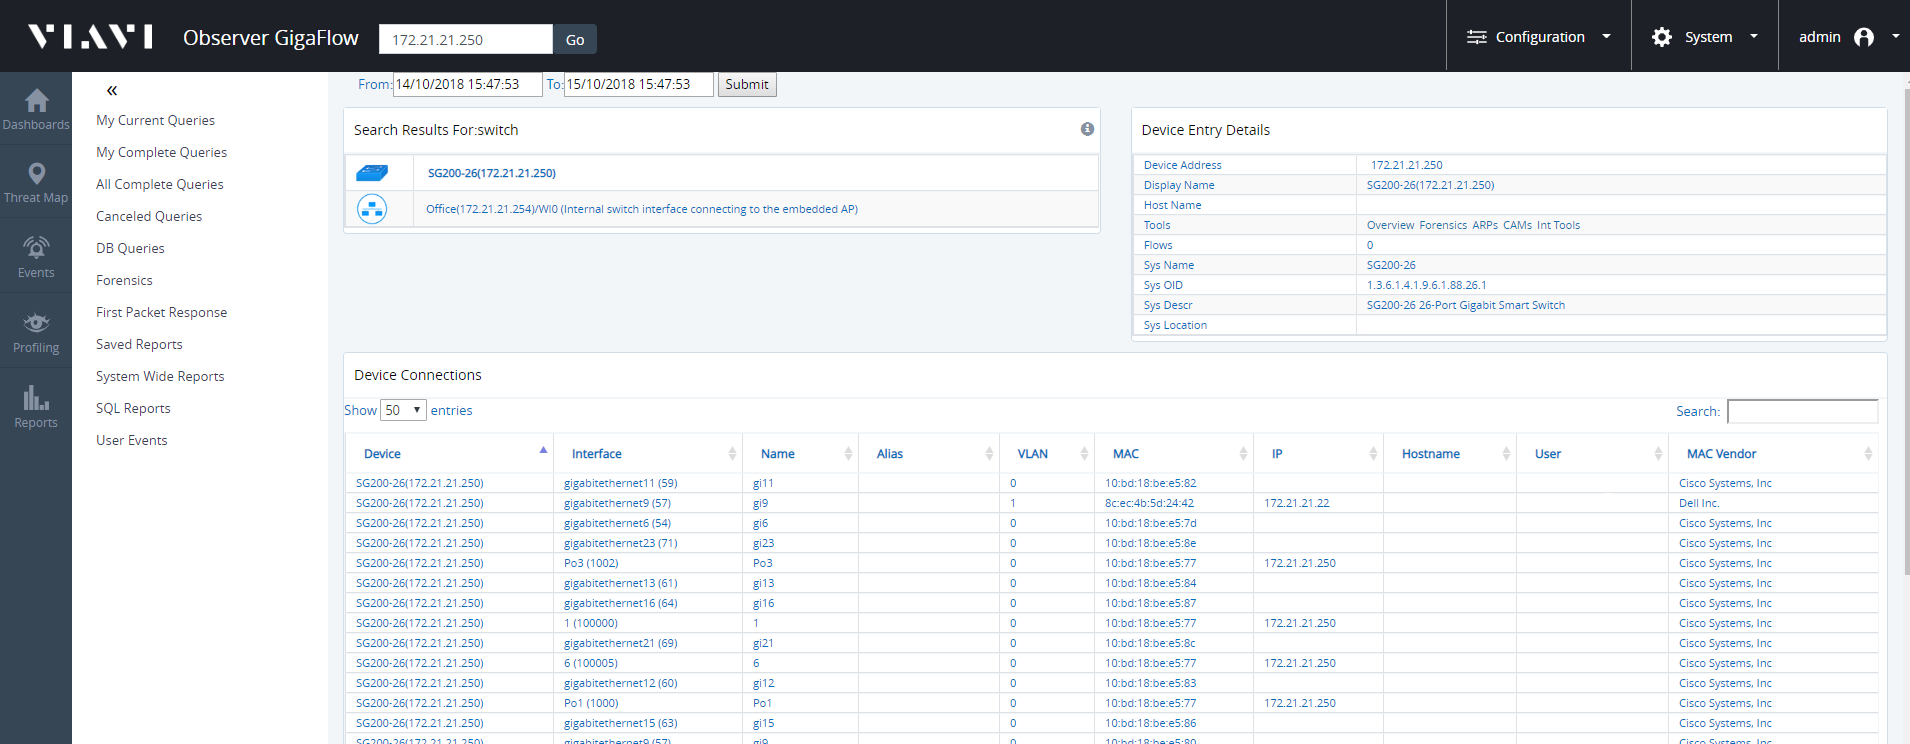
To search for a specific network switch:
- Enter the switch IP address into the search box.
- Click the icon beside the displayed switch; this will open the Device Connections table.
- The Device Connections table shows connections to any one port on any one VLAN.
- You can filter information by entering an interface, or device etc., into the search bar at the top-right of the table.
To make a follow-on search from a specific device or switch:
- Using switches from previously displayed tables, you can search for any switches of similar origin, e.g containing the same name elements.
- Click on the desired switch; this reopens the Device Connections table.
- You can also search by VLAN.
Apply a Macro (or Script) to a Switchport
Using GigaFlow Search, enter a known IP address associated with switch or the switch name and search:
- Click on the the displayed switch name, in this case SG200-26(172.21.21.250).
- Click on Int Tools in the Tools section of the right-hand side panel.
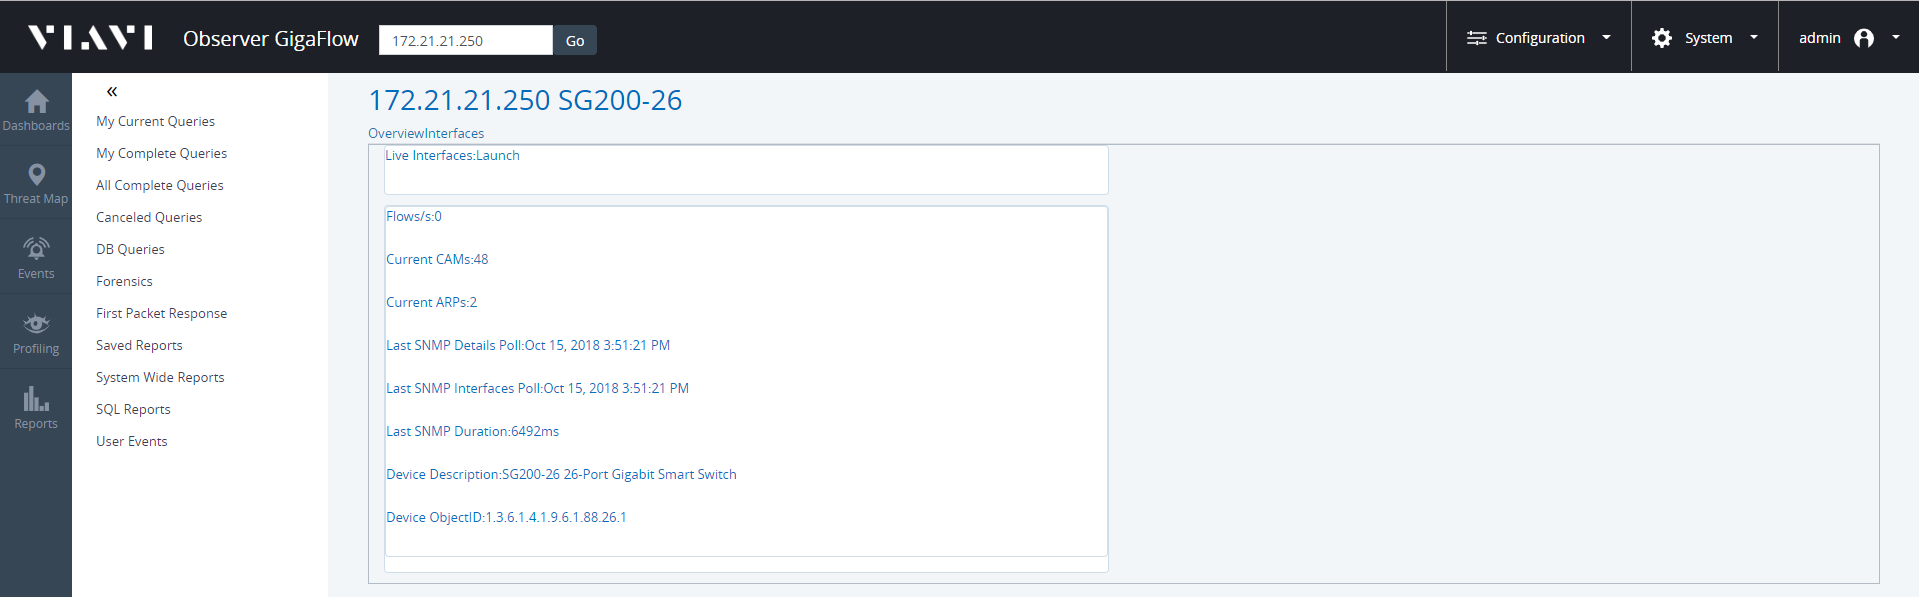
- Click on Interfaces next to Overview, at the top of the page.
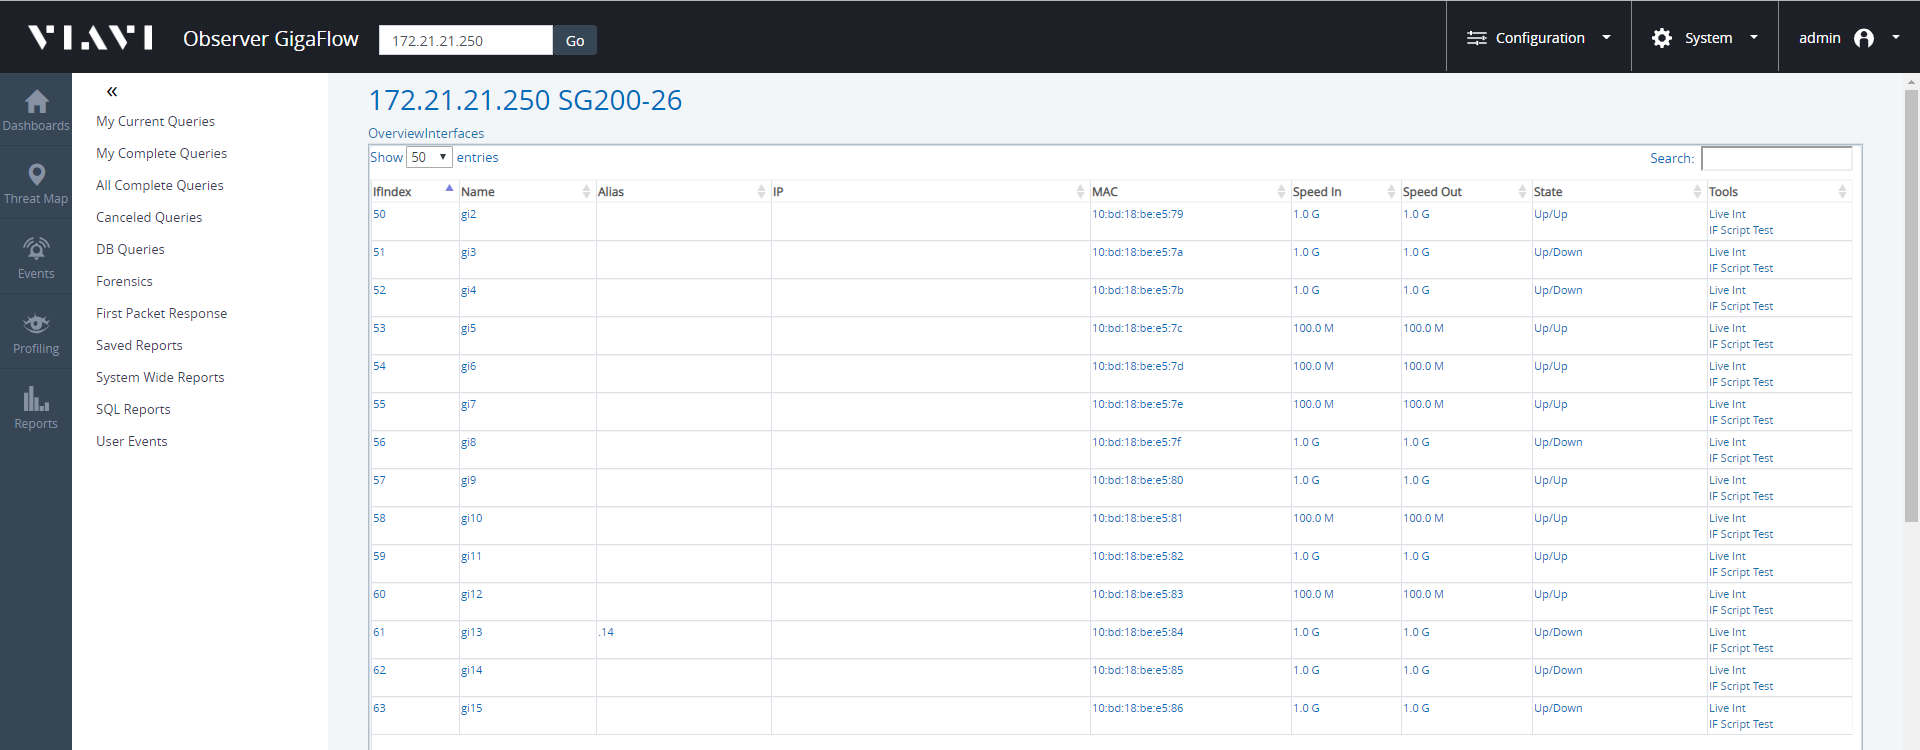
- Find the interface that the script will run on.
- On that interface click IF Script Test in the last column on the right.
- Add the ticket number into the description field.
- Select the script.
- Click Submit.
- GigaFlow will check that the interface is not an uplink to another switch.
- The script will be applied to the switch.
Select a site, device or remote branch directly from the Dashboard > Summary Device and Dashboard > Interface Summary pages. Use GigaFlow Search when the site, device or remote branch is not listed.
After searching by IP address, click on the Device Name in the panel on the left. The information in the panel on the right-hand side of the screen will refresh. Click Overview in the Tools section of this panel.
Figure: Sample results from GigaFlow's search for an internal IP address
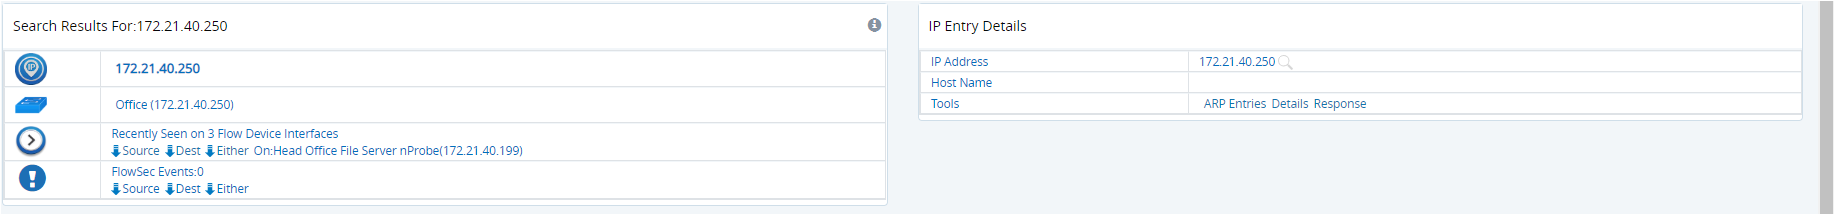
In the Summary Interfaces panel, click on any interface to get overview information.
If you are interested in inbound - or download - traffic, select the Drill Down icon  beside the interface name from the Summary Interfaces In panel.
A list of the application traffic, ranked by volume, will be displayed here; this Application Flows report will include details of the internal IP address communicating with this application.
You can view historical flow data by selecting any date or time.
Select a site, device or remote branch directly from the Dashboard > Summary Device and Dashboard > Interface Summary pages. Search using the main GigaFlow Search when the site, device or remote branch is not listed.
After searching by IP address, click on the Device Name in the panel on the left. The information in the panel on the right-hand side of the screen will refresh. Click Overview in the Tools section of this panel.
Figure: Sample results from GigaFlow's search for an internal IP address
In the Summary Interfaces panel, click on any interface to get an overview.
If you are interested in inbound - or download - traffic, select the Drill Down icon beside the interface name from the Summary Interfaces In panel.
A list of the application traffic, ranked by volume, will be displayed here; this Application Flows report will include details of the internal IP address communicating with this application.
You can view historical flow data by selecting any date or time.
From the Report drop-down menu at the top of the screen, select Application Flows with Users and click submit  .
.
To see all traffic for a particular user, click the Drill Down icon to the left of that user. Click submit Forensics check and submit icon. once more.
First Packet Response (FPR) is a useful diagnostic tool, allowing you to compare the difference between the first packet time-stamp of a request flow and the first packet time-stamp of the corresponding response flow from a server. By comparing the FPR of a transaction with historical data, you can troubleshoot unusual application performance.
Application performance can be affected by many types of transaction: credit card transactions, DNS transactions, loyalty club reward transactions or any type of hosted transaction.
Ensure that First Packet Response (FPR) is enabled for each application. See Configuration > Server Subnets in the Reference Manual.
Select a site, a device or a remote branch directly from the Dashboard > Summary Device and Dashboard > Interface Summary pages. Access the Forensics report page by clicking the Drill Down icon in the Summary Devices table.
Search using the main GigaFlow Search when the site, device or remote branch is not listed. After searching by IP address, click on the Device Name in the panel on the left. The information in the panel on the right-hand side of the screen will refresh. Click Forensics in the Tools section of this panel.
Figure: Sample results from GigaFlow's search for an internal IP address
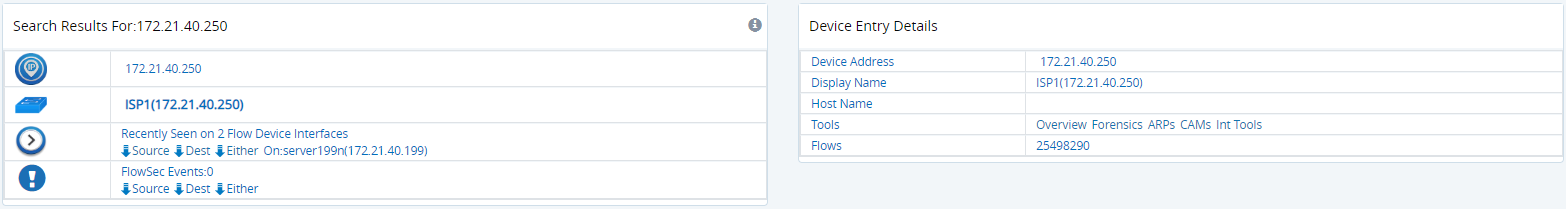
The panel on the right is displayed when the IP address is selected in the left-hand side panel.
Whether you arrive via the Dashboard or using GigaFlow Search, the Forensics report page will open with an Application Flows report.
Select Applications from the drop-down Report menu. Click the Submit icon to refresh the Forensics report page.
For demonstration purposes, we are looking for credit card related application data not displayed in the most used applications graph. To any application not listed in the top applications, change the view from graph to table.
Select 100 entries.
After identifying the application associated with credit card transactions, click the Forensics Drill Down icon to the left of the application and choose Selected from the hover option list. Click Submit Forensics check and submit icon. again.
Select the All Fields Max FPR (First Packet Response) report type from the drop-down menu. Change the view from table to graph and click Submit .
GigaFlow will return the response times for credit card applications in the reporting period. By clicking on the graph or selecting from the calendar, you can view response times over the period. The application response times, along the y-axis, are given in milliseconds.
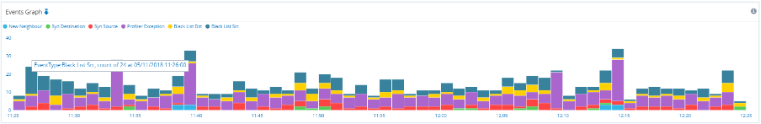
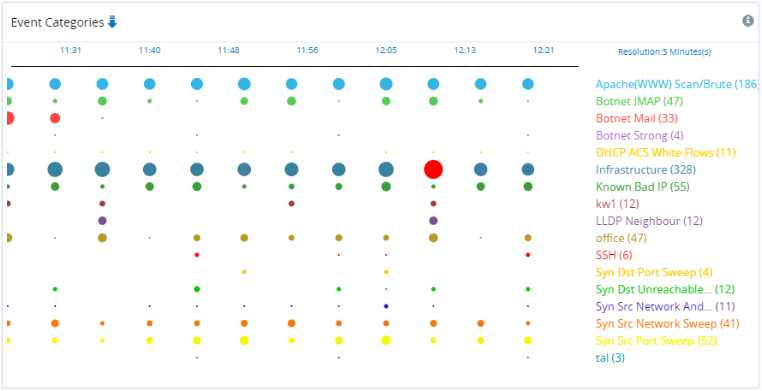
Click Events in the main menu. GigaFlow will display information about the network events during the reporting period, including:
By clicking once on any legend item, you will be taken to a detailed report, e.g. detailed reports for each Event Type, Source Host, Infrastructure Device, Event Category and Target Host.
Identify any internal IP address from your network that appears on the Event Target Host(s) list. If an internal IP address appears on the list, the associated device is infected and communicating with a known threat on the internet. Click on the IP address to find out who it is communicating with.
See System > Event Scripts and the GigaFlow Wiki for more.
Traffic groups are subnet and IP range aliases. Using traffic groups can help you to identify problems within logical groupings of IP address, e.g. by site or subnet. Once a traffic group is defined, GigaFlow will begin to record information about it.
To define a new traffic group, click Configuration > Traffic Groups. Existing Traffic Groups are displayed in the main table. To add a new Traffic Group:
- Enter the name of the new traffic group.
- Enter a description of the new traffic group.
- Enter a start IP address for the traffic group, e.g. 172.1.1.0.
- Enter an end IP address for the traffic group, e.g. 172.1.1.255.
- Click Add Traffic Group to add the traffic group.
To bulk-add new traffic groups, i.e. more than one group at a time:
- Enter required traffic group information using the format:
name,description,startip,endip - Use a new line for each new traffic group.
To monitor defined traffic groups, go to Profiling > Traffic Groups.
Sometimes, it can be useful to define a traffic group by subnet and by infrastructure device. For example, a corporate network could have a subnet served by more than one router. To create a granular view of flow through each router, a separate traffic group could be created for each router, defined by the IP range of the subnet as well as the device name. Type in the filter box to quickly identify a device.
To edit a traffic group definition, click Configuration > Traffic Groups and click on the traffic group name or on the adjacent Drill Down icon . This will bring up a new page for that traffic group where you can edit the group definition.
Profiling is a very powerful feature. A flow object is a logical set of defined flows and IP source and destination addresses. Flow objects make it possible to build up a complex profile or profiler quickly. These terms are used interchangeably. A particular network behaviour that involves network flow objects is described by a Profiler. Profiling allows you to congigure both the profiles of the flows to be tested, the entry flows, and the profiles of the allowed flows, i.e. the templates against which the entry flows are tested.
To get going, create your first profile. See Configuration > Configuration/Profiling in the GigaFlow Reference Manual.
Step one is then to create a new flow object. To create a flow object:
- Go to Configuration > Profiling.
- Select the Apps/Objects tab.
- In the New Flow Object section, specify the flows that make up the object.
You can add ANDd existing profile(s) to the new flow object, i.e. the new definitions are added to the existing profile(s).
You can also select alternative existing profile(s) that this new profile also maps to (ORd), i.e. the new flow object uses either the new definitions or the existing flow object definitions.
To ANDd or ORd profile(s), use the drop-down menu in the flow object definitions and click the +.
As an example, a printer installation at a particular location connected to a particular router can be defined by a flow object that consists of:
- A printer flow object.
- ANDd a location flow object.
- ANDd a router flow object.
Or
- The flow object could define the IP address of a server and the web port(s).
A second flow object can be defined that will have its flow checked against the Allowed profile; this is an Entry profile.
To create a new Profiler (this term is used interchangeably with profile):
- Go to Configuration > Profiling.
- Give the new Profiler a name and description.
- Select an Entry profile (the profile to be monitored) and an Allowed profile (the acceptable profile) from the drop-down lists. The Entry and Allowed profile selection includes basic flow objects, i.e. individual devices on your network. A profile is a flow object that is itself a combination of flow objects.
- If you want to be alerted when an exception occurs, select Yes from the drop-down menu.
Select the Apps/Options tab.
GigaFlow comes loaded with a standard set of application port and protocol definitions. Flow records are associated with application names if there is a match.
Users can define their own application names within the software and have that application ID (Appid) available within the flow record. There are 3 techniques used, applied in order:
- Customers can define an application profile which lets them match traffic by source/destination IP address, source/destination port, source/destinaton MAC address, protocol, COS and/or nested rules.
- They can assign their own application names to specificed IP ports, i.e. create Named Applications.
- Or, if there are no user defined settings, the software will select the lowest port.
Select the Apps/Options tab.
To create a new Defined Application:
- Go to Configuration > Profiling.
- Select the Apps/Objects tab.
- In the New Defined Application section, specify a name, a description and select the flow object that is associated with the application.
- Click + to add the application.
The Realtime Profiling Status at Profiling > Realtime Overview shows realtime data on defined Profilers. The display updates every 5 seconds and shows:
- Profiler: this is the defined profile.
- Clients: the number of connected devices.
- Hits: the number of flow records that have matched the allowed flows.
- Exceptions: the flow records for this profile that have deviated from the ideal, or Allowed, profile. See Configuration > Profiling.
The Profiling Event Dashboard at Profiling > Profiling Events gives an overview of profile events.
At the top of the page you can set both the reporting period and resolution, from one minute to 4 weeks.
The Profiles infographic shows a timeline of the number of events with the profile(s) involved. Circle diameters represent the number of events. The peak number of events in the timeline for each profile are highlighted in red.
The Severities infographic shows a timeline of the number of events along with their estimated severity level(s). Circle diameters represent the number of events. The peak number of events in the timeline for each severity level are highlighted in red.
The Event Entries table gives a breakdown of profile events with the following entries:
- The unique event ID number.
- The time at which event occurred.
- The category or profile name.
- The severity of the event as a percentage.
- The source IP address.
- The target IP address.
- The application, user defined if it exists. See also Configuration > Profiling and Flow Details.
- Any information other error/status message, e.g. Profiler Exception.
A drop-down selector lets you choose the number of the most events to display.
To access a detailed overview of any flow, click on the adjacent Drill Down icon . This provides a complete overview of that flow, listing:
- The source address, a link to search forensics and any associated blacklists.
- Source MAC address.
- Destination address, a link to search forensics and any associated blacklists.
- Destination MAC address.
- Source port.
- Destination port.
- Appid: the application ID is a unique identifier for each application.
In GigaFlow, Appid is a positive or negative integer value. The way in which the Appid is generated depends on which of the 3 ways the application is defined within the system. Following the hierarchy outlined in Configuration > Profiling -- Apps/Options -- Defined Applications, a negative unique integer value is assigned if (1) the application is associated with a Profile Object or (2) if it is named in the system. If the application is given by its port number only (3), a unique positive integer value is generated that is a function of the lowest port number and the IP protocol.
- Application. See Appid, above, and Configuration > Profiling.
- Number of packets in flow.
- Number of bytes.
- User.
- Domain.
- Fwevent. See
- Fwextcode.
- Profile, e.g. PCs.
- Net device IP address, name and number of flows.
- In-Interface.
- Out-Interface.
See Glossary for more about flow record fields used by GigaFlow.
See also Search for instructions to access the Graphical Flow Mapping feature.
By clicking any Category, Severity, Source IP or Target IP in the Event Entries table, you will be taken to a version of the Events Dashboard filtered for that item.
See Dashboards > Events for an overview of the structure of this page.
An integration allows you to call defined external web pages or scripts directly from the Device Interface Overview page. To add an integration, navigate to System > Global. In the Integrations settings box, you can add or change an integration.
There are two types of integration:
- Device: where you can pass the device IP address.
- Interface: where you can pass the device IP address and the ifIndex of the interface being used.
To add an integration:
- Enter a new name, e.g. "Interface Action 1".
- Select the type of target, i.e. a device or an interface. These map to the IP address of the device and the ifIndex of the interface.
- Select the type of action, i.e. will the integration work with a web page or a script.
- Enter the web page URL or select a script.
- Enter inputs to be passed via the website or script.
- Click Save to save changes.
Example 1
In the code below, the populated field tells the software that you want to populate the device field with the IP address and the ifindex field with the ifindex. These fields (device and ifindex) will be passed to the target. We also have required fields, which are fields which the user is required to populate.
{ 'populated':{ 'device':'flow_device', 'ifindex':'flow_ifindex'},'required':[ {'name':'user','display':,'type':'text','value':}, {'name':'password','display':'Password','type':'password'}, {'name':'macro','display':'What Macro?','type':'select','data':['macro1','macro2','macro3','macro4']}]} Example 2:
var ProcessBuilder = Java.type('java.lang.ProcessBuilder');var BufferedReader = Java.type('java.io.BufferedReader');var InputStreamReader= Java.type('java.io.InputStreamReader');output.append(data);output.append("Device IP:"+data.get("device")+"");output.append("IFIndex:"+data.get("ifindex")+""); try { // Use a ProcessBuilder //var pb = new ProcessBuilder("ls","-lrt","/"); //linux var pb = new ProcessBuilder("cmd.exe", "/C", "dir"); //windows output.append("Command Run"); var p = pb.start(); var is = p.getInputStream(); var br = new BufferedReader(new InputStreamReader(is)); var line = null; while ((line = br.readLine()) != null) { output.append(line+""); } var r = p.waitFor(); // Let the process finish. if (r == 0) { // No error // run cmd2. } output.append("All Done"); } catch ( e) { output.append(e.printStackTrace()); }log.warn("end")See System > Global in the Reference Manual for more.
See System > Alerting in the Reference Manual to enable email alerts.
You will receive a GigaFlow alert email when a device in your network makes a connection to a blacklisted IP address. The embedded link will direct you to an Events page that summarises interactions with the blacklisted IP address during the reporting period.
See Determine if Bad Traffic is Affecting Your Network for more.
If you receive intelligence about a specific IP Address, MAC Address, network device or user, carry out a GigaFlow Search on the object. For this example, we will search by IP address.
After searching by IP address, click By Either in the panel on the left.
This will bring you to an Events page that summarises interactions with the IP address during the reporting period. Using this information, you can build a picture of the importance of the event.
See Determine if Bad Traffic is Affecting Your Network for more.
To view historical information, select the relevant dates and times at the top of the page.
See Reports > System Wide Reports > SYN Forensics Monitoring in the Reference Manual.
GigaFlow monitors all TCP flows where only the SYN bit is set. In normal network operations, this indicates that a flow has not seen a reply packet while active in a router's Netflow cache.
A lonely SYN can be an indicator that:
- Routing was asymmetric. Perhaps the reply returned via a different router.
- Reply traffic was blocked.
- Servers were not responding for some reason.
- Something was probing the network.
To view objects that are behaving anomalously, navigate to Reports > System Wide Reports > SYN Forensics Monitoring
You will see a summary of all the internal sources listed in order of the number of destination objects associated with each internal source.
Click the Drill Down icon for more information about each IP address.
See also System > GigaFlow Cluster.
Overview
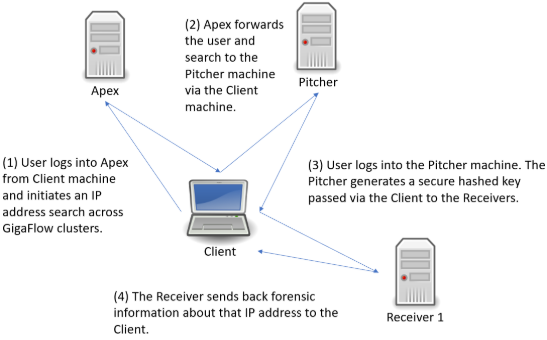
A single GigaFlow server can be configured to search for IP addresses across many remote GigaFlow servers directly from Viavi's Apex system. This feature is useful for large organisations that may have many GigaFlow servers monitoring different networks within the organisation, e.g. in different regions. The central administrator may want a view across the entire network, e.g. to determine if a particular suspect IP address has been recorded by routers on different networks.
In this example, assume that you, as the main administrator, want visibility on several remote GigaFlow servers.
The set-up is:
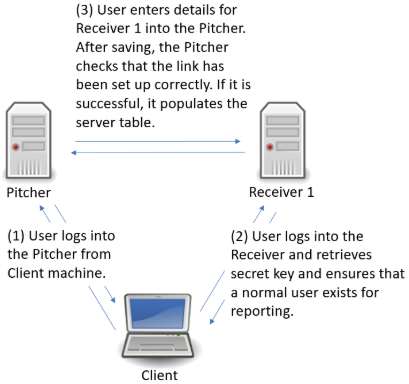
- GigaFlow Server #0: this is the server at HQ, used by the main administrator. We call this the Pitcher.
- GigaFlow Server #1: this is remote GigaFlow server #1. We call this Receiver 1.
- GigaFlow Server #2: this is remote GigaFlow server #2. We call this Receiver 2.
- GigaFlow Server #3: this is remote GigaFlow server #3. We call this Receiver 3.
Figure: Defining a GigaFlow cluster
Configure the Cluster
Log in to GigaFlow Server #0, the Pitcher, and navigate to System > GigaFlow Cluster.
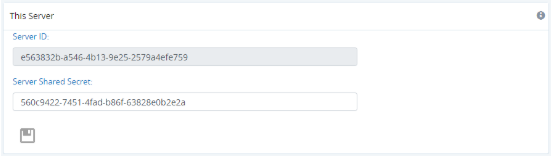
In the This Server panel, you will see a pre-generated unique secret. Leave this as is.
In another browser tab or window, log into Receiver 1 (GigaFlow Server #1). Copy the unique secret from Receiver 1's This Server panel. You do not need to do anything with the New Cluster Server panel on the receivers.
Figure: This Server panel
Switch back to the Pitcher (GigaFlow Server #0). In the New Cluster Server panel:
- Enter a name that you will see during a search across servers, i.e. Receiver 1.
- Enter the description that you will see when hovering-over the server name during a search across servers, e.g. "EMEA GigaFlow server (Receiver 1)".
- Enter the full URL, including port number, used to connect to Receiver 1, i.e. in the format "http(s)://172.1.1.0:22".
- Enter the IP address of the Pitcher system as seen by Receiver 1. This IP address is used by the Pitcher to generate a secure hashed key for communication. The Receiver reverses this hash using, among other things, the IP address of the Pitcher. An intermediate firewall (NAT) could create problems if the Pitcher does not create the hashed key using the IP address seen by the Receiver.
- Enter the UserID used when making superuser calls to Receiver 1, e.g. Admin. This is used during this set-up process.
- Enter the UserID that will be used when making report requests, e.g. reportuser; this is used by all clients when collecting data from the Receiver. This user must exist on Receiver 1. If it does not exist, switch to Receiver 1 and create a new normal user on Receiver 1, i.e. reportuser.
- Paste Receiver 1's secret, i.e. the key copied from Receiver 1's This Server panel.
- Click Save <img src = "./assets/images/save_icon.png" alt = "Save icon." width = "14px" height = "14px"> to add the Receiver 1.
- The Pitcher will connect to Receiver 1 using the Admin user to verify that everything is correct and to populate the table at bottom of the System page. Receiver 1 will appear in the main table.
Figure: New Cluster Server panel

Repeat this process for Receiver 2 and Receiver 3.
The cluster server feature is flexible; a receiver in one cluster can be a pitcher for another.
Search the GigaFlow Cluster
Figure: Conducting a GigaFlow Cluster search
Following the search link from Apex, you will be brought to a new tab and the log in screen for the Pitcher machine. After logging in, you will be brought to the GigaFlow Cluster report page.
Figure: The initial view of the GigaFlow Cluster report page

This displays a list of hits for this IP address across the cluster; in this example, the IP address 172.21.21.21 was found on 11 devices monitored by three receivers. On these receivers the system found 9 devices with data matching the search and there were no errors.
In the first first table, each GigaFlow server is listed with:
- Server name.
- The URL to connect to the server; follow this link to access the full UI for that particular server.
- The type of result; in this case flows.
- Which device monitored by this server had the data.
- Device details: name, interface and the number of flows seen.
- A number and visualization of the data size; this is a ranking of result relevance.
- A drill-down link to forensics data for each result. A full view into the receiver is displayed below the top table; this allows you to view the results and interact with that GigaFlow server without having to leave this page.
Figure: Clicking on the drill down icon beside a result brings up the full user interface and a forensics report for that device on the associated GigaFlow server

The system allows ten minutes between running the report and viewing these results without re-authentication.
You can also select different report types to run on that device on that GigaFlow server by selecting from the drop-down menu. See Reports > Forensics in the main Reference Manual for more.
Encryption and GigaFlow Clusters
Communication between all clients in a Gigaflow cluster is IP to IP, i.e. unicast. The traffic is routed over https, using TLS based on certificates.
We test against the latest Mozilla Firefox, MicroSoft Edge and Google Chrome browsers.
See here for a useful server size calculator.
Flows and Server Sizing
GigaFlow has been tested and certified to support up to 1,000 concurrent devices or up to 40,000 flows per second (flow/s) from less than 20 devices.
The flow rate changes with the number of connected devices as follows:
| Flow/s | Number of Devices |
|---|
|
| 50,000 | 10 |
| 40,000 | 20 |
| 20,000 | 40 |
| 10,000 | 80 |
| 5,000 | 160 |
| 2,500 | 300 |
| 1,250 | 600 |
| 1,000 | 1,000 |
Disk Throughput for Flow Writing to Database
Allow for at least 600 bytes per flow record per second for I/O throughput, i.e.
| Flow/s | Bytes/s (Sustained Write Performance) | MB/s (Sustained Write Performance) |
|---|
|
| 100 | 60,000 | 0.06 |
| 2,000 | 1,200,000 | 1.2 |
| 10,000 | 6,000,000 | 6.0 |
| 40,000 | 24,000,000 | 24.0 |
Disk I/O for Flow Writing To Database
With
f = flow/s
d = number of devices
I = Input/Output performance measurement (IOP), nominally sustained sequential writing.
I = 20 + (f / 500) + (d / 5)
i.e. allow for a base of 20 IOPs, add an additional 1 IOP/s for every 500 flow/s and another 1 IOP/s for every 5 devices.
| Flow/s | Number of Devices | IOPs |
|---|
|
| 1,000 | 1,000 | 222 |
| 5,000 | 1,000 | 230 |
| 10,000 | 100 | 60 |
| 40,000 | 10 | 102 |
Disk I/O for Flow Reading from Database
Allow for at least 100 IOPs read.
Disk Sizing
The server must support at least 300 MB/s sustained read and write to handle the peak device or flow count. Anything less than this will result in dropped flows. For Linux, we recommend EXT4 or XFS file systems as well a dedicated RAID partition for the database. Adding a hardware RAID controller that supports RAID 10, or at least RAID 5, will improve performance and provide hardware redundancy. The amount of storage required is directly related to the flow rate and features enabled.
| Data Type | Minimum Space Per Record (Bytes) |
|---|
| Forensics Flow | 250 |
| Event Record | 900 |
500 flow/s of forensics == 450 MB per hour == 11 GB disk space per day.
RAM Sizing
A basic installation should have 4 GB RAM available for the OS and additional 50 MB per device to monitor. More RAM will always improve performance:
| Number of Devices | Minimum RAM (GB) |
|---|
| 10 | 4.5 |
| 100 | 9 |
| 500 | 29 |
| 1,000 | 54 |
CPU Sizing
CPU sizing in GigaFlow is based on the Postgre SQL database. Overall performance is also dependent on CPU performance.
While there is little to gain by going beyond 8 cores, more powerful CPUs will provide a better experience. Intel's Xeon X5680 3GHz or Core i7-3770S 3GHz are recommended as a minimum required specification.
Experimental Results
As a demonstration, GigaFlow was installed on a typical server with the following specifications:
- HP DL360 Gen 6.
- 72 GB RAM.
- 2x 8 core (Intel Xeon, E5530 @ 2.40GHZ).
- 4x 146 GB SAS 10K RPM drives (432320-001 3GB/s) in a RAID 10 configuration.
- P410i RAID controller with 1 GB RAM.
- Linux CentOS 7, single partition.
The results of a performance test were as follows:
| Devices | Flows | Total Flows | CPU Idle | Disk Write | IO Writes | Disk Utilisation | Notes |
| - | per device s-1 | - | % | MB s-1 | s-1 | % | - |
| 10 | 15,000 | 15,0000 | 80 | 88 | 250 | 9 | |
| 50 | 3,000 | 150,000 | 78 | 91 | 260 | 11 | |
| 100 | 1,500 | 150,000 | 78 | 91 | 261 | 11 | At limit of flow cache before flows are dropped. |
| 250 | 400 | 100,000 | 85 | 62 | 142 | 5 | Must double RAM used by GigaFlow to 1,536 MB. |
| 500 | 200 | 100,000 | 86 | 58 | 190 | 10 | Must double RAM used by GigaFlow to 1,536 MB. |
| 1,000 | 100 | 100,000 | 85 | 59 | 232 | 10 | Must double RAM used by GigaFlow to 1,536 MB. |
| 2,000 | 50 | 100,000 | 82 | 59 | 220 | 10 | Must double RAM used by GigaFlow to 1,536 MB. |
These results show that this relatively mid-specification machine can cope with 50 devices at 150K flows per second. The same system can handle 2,000 devices with a cumulative count of 100K flows/s.
We recommend a maximum of 1,000 devices per GigaFlow server. Above this, database query performance will degrade.
Yes, there is a REST endpoint for all report data with a portal user definitions to control access. You can open your GigaFlow system for integration with third party applications.
For more information, see API articles at the official GigaFlow Wiki.
No, your GigaFlow system is accessed via a HTML/Javascript front-end using your preferred browser. Output is rendered as HTML, .csv or .pdf.
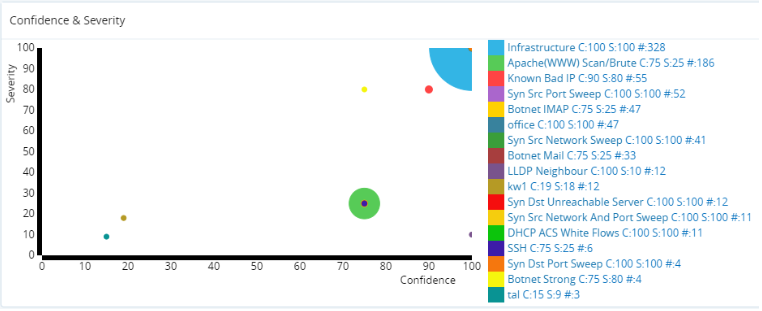 Confidence & Severity Infographic.