Documentation >
How-To Guide for GigaFlowSelect a site, device or remote branch directly from the Dashboard > Summary Device and Dashboard > Interface Summary pages. Use GigaFlow Search when the site, device or remote branch is not listed.
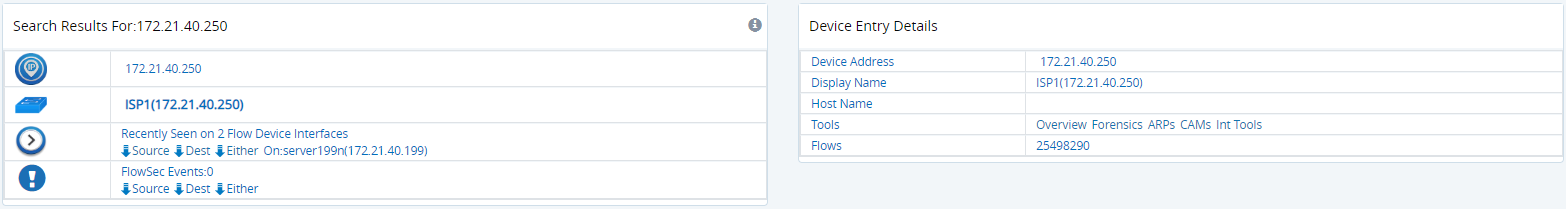
After searching by IP address, click on the Device Name in the panel on the left. The information in the panel on the right-hand side of the screen will refresh. Click Overview in the Tools section of this panel.
Figure: Sample results from GigaFlow's search for an internal IP address
In the Summary Interfaces panel, click on any interface to get overview information.
If you are interested in inbound - or download - traffic, select the Drill Down icon  beside the interface name from the Summary Interfaces In panel.
A list of the application traffic, ranked by volume, will be displayed here; this Application Flows report will include details of the internal IP address communicating with this application.
You can view historical flow data by selecting any date or time.
Select a site, device or remote branch directly from the Dashboard > Summary Device and Dashboard > Interface Summary pages. Search using the main GigaFlow Search when the site, device or remote branch is not listed.
After searching by IP address, click on the Device Name in the panel on the left. The information in the panel on the right-hand side of the screen will refresh. Click Overview in the Tools section of this panel.
Figure: Sample results from GigaFlow's search for an internal IP address
In the Summary Interfaces panel, click on any interface to get an overview.
If you are interested in inbound - or download - traffic, select the Drill Down icon beside the interface name from the Summary Interfaces In panel.
A list of the application traffic, ranked by volume, will be displayed here; this Application Flows report will include details of the internal IP address communicating with this application.
You can view historical flow data by selecting any date or time.
From the Report drop-down menu at the top of the screen, select Application Flows with Users and click submit  .
.
To see all traffic for a particular user, click the Drill Down icon to the left of that user. Click submit Forensics check and submit icon. once more.
First Packet Response (FPR) is a useful diagnostic tool, allowing you to compare the difference between the first packet time-stamp of a request flow and the first packet time-stamp of the corresponding response flow from a server. By comparing the FPR of a transaction with historical data, you can troubleshoot unusual application performance.
Application performance can be affected by many types of transaction: credit card transactions, DNS transactions, loyalty club reward transactions or any type of hosted transaction.
Ensure that First Packet Response (FPR) is enabled for each application. See Configuration > Server Subnets in the Reference Manual.
Select a site, a device or a remote branch directly from the Dashboard > Summary Device and Dashboard > Interface Summary pages. Access the Forensics report page by clicking the Drill Down icon in the Summary Devices table.
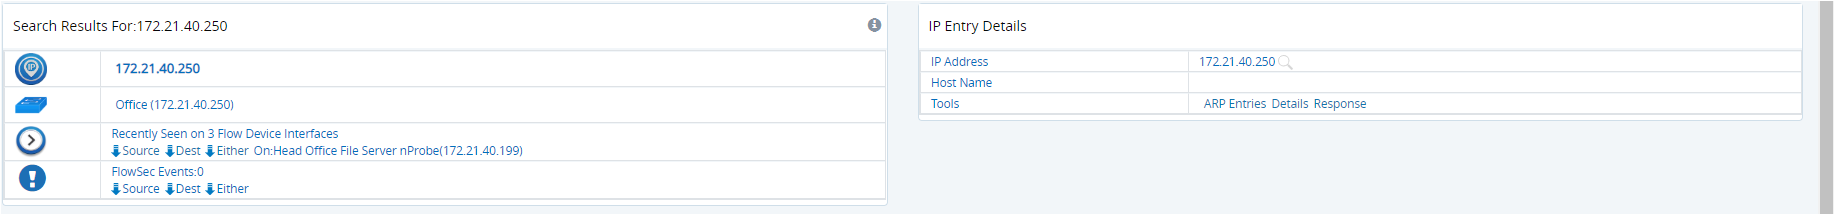
Search using the main GigaFlow Search when the site, device or remote branch is not listed. After searching by IP address, click on the Device Name in the panel on the left. The information in the panel on the right-hand side of the screen will refresh. Click Forensics in the Tools section of this panel.
Figure: Sample results from GigaFlow's search for an internal IP address
The panel on the right is displayed when the IP address is selected in the left-hand side panel.
Whether you arrive via the Dashboard or using GigaFlow Search, the Forensics report page will open with an Application Flows report.
Select Applications from the drop-down Report menu. Click the Submit icon to refresh the Forensics report page.
For demonstration purposes, we are looking for credit card related application data not displayed in the most used applications graph. To any application not listed in the top applications, change the view from graph to table.
Select 100 entries.
After identifying the application associated with credit card transactions, click the Forensics Drill Down icon to the left of the application and choose Selected from the hover option list. Click Submit Forensics check and submit icon. again.
Select the All Fields Max FPR (First Packet Response) report type from the drop-down menu. Change the view from table to graph and click Submit .
GigaFlow will return the response times for credit card applications in the reporting period. By clicking on the graph or selecting from the calendar, you can view response times over the period. The application response times, along the y-axis, are given in milliseconds.
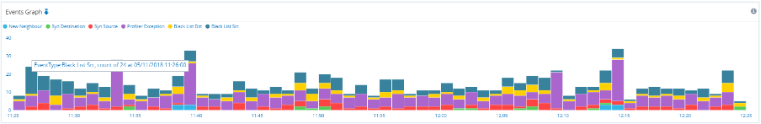
Click Events in the main menu. GigaFlow will display information about the network events during the reporting period, including:
By clicking once on any legend item, you will be taken to a detailed report, e.g. detailed reports for each Event Type, Source Host, Infrastructure Device, Event Category and Target Host.
Identify any internal IP address from your network that appears on the Event Target Host(s) list. If an internal IP address appears on the list, the associated device is infected and communicating with a known threat on the internet. Click on the IP address to find out who it is communicating with.
See System > Event Scripts and the GigaFlow Wiki for more.
Traffic groups are subnet and IP range aliases. Using traffic groups can help you to identify problems within logical groupings of IP address, e.g. by site or subnet. Once a traffic group is defined, GigaFlow will begin to record information about it.
To define a new traffic group, click Configuration > Traffic Groups. Existing Traffic Groups are displayed in the main table. To add a new Traffic Group:
- Enter the name of the new traffic group.
- Enter a description of the new traffic group.
- Enter a start IP address for the traffic group, e.g. 172.1.1.0.
- Enter an end IP address for the traffic group, e.g. 172.1.1.255.
- Click Add Traffic Group to add the traffic group.
To bulk-add new traffic groups, i.e. more than one group at a time:
- Enter required traffic group information using the format:
name,description,startip,endip - Use a new line for each new traffic group.
To monitor defined traffic groups, go to Profiling > Traffic Groups.
Sometimes, it can be useful to define a traffic group by subnet and by infrastructure device. For example, a corporate network could have a subnet served by more than one router. To create a granular view of flow through each router, a separate traffic group could be created for each router, defined by the IP range of the subnet as well as the device name. Type in the filter box to quickly identify a device.
To edit a traffic group definition, click Configuration > Traffic Groups and click on the traffic group name or on the adjacent Drill Down icon . This will bring up a new page for that traffic group where you can edit the group definition.
Profiling is a very powerful feature. A flow object is a logical set of defined flows and IP source and destination addresses. Flow objects make it possible to build up a complex profile or profiler quickly. These terms are used interchangeably. A particular network behaviour that involves network flow objects is described by a Profiler. Profiling allows you to congigure both the profiles of the flows to be tested, the entry flows, and the profiles of the allowed flows, i.e. the templates against which the entry flows are tested.
To get going, create your first profile. See Configuration > Configuration/Profiling in the GigaFlow Reference Manual.
Step one is then to create a new flow object. To create a flow object:
- Go to Configuration > Profiling.
- Select the Apps/Objects tab.
- In the New Flow Object section, specify the flows that make up the object.
You can add ANDd existing profile(s) to the new flow object, i.e. the new definitions are added to the existing profile(s).
You can also select alternative existing profile(s) that this new profile also maps to (ORd), i.e. the new flow object uses either the new definitions or the existing flow object definitions.
To ANDd or ORd profile(s), use the drop-down menu in the flow object definitions and click the +.
As an example, a printer installation at a particular location connected to a particular router can be defined by a flow object that consists of:
- A printer flow object.
- ANDd a location flow object.
- ANDd a router flow object.
Or
- The flow object could define the IP address of a server and the web port(s).
A second flow object can be defined that will have its flow checked against the Allowed profile; this is an Entry profile.
To create a new Profiler (this term is used interchangeably with profile):
- Go to Configuration > Profiling.
- Give the new Profiler a name and description.
- Select an Entry profile (the profile to be monitored) and an Allowed profile (the acceptable profile) from the drop-down lists. The Entry and Allowed profile selection includes basic flow objects, i.e. individual devices on your network. A profile is a flow object that is itself a combination of flow objects.
- If you want to be alerted when an exception occurs, select Yes from the drop-down menu.
Select the Apps/Options tab.
GigaFlow comes loaded with a standard set of application port and protocol definitions. Flow records are associated with application names if there is a match.
Users can define their own application names within the software and have that application ID (Appid) available within the flow record. There are 3 techniques used, applied in order:
- Customers can define an application profile which lets them match traffic by source/destination IP address, source/destination port, source/destinaton MAC address, protocol, COS and/or nested rules.
- They can assign their own application names to specificed IP ports, i.e. create Named Applications.
- Or, if there are no user defined settings, the software will select the lowest port.
Select the Apps/Options tab.
To create a new Defined Application:
- Go to Configuration > Profiling.
- Select the Apps/Objects tab.
- In the New Defined Application section, specify a name, a description and select the flow object that is associated with the application.
- Click + to add the application.
The Realtime Profiling Status at Profiling > Realtime Overview shows realtime data on defined Profilers. The display updates every 5 seconds and shows:
- Profiler: this is the defined profile.
- Clients: the number of connected devices.
- Hits: the number of flow records that have matched the allowed flows.
- Exceptions: the flow records for this profile that have deviated from the ideal, or Allowed, profile. See Configuration > Profiling.
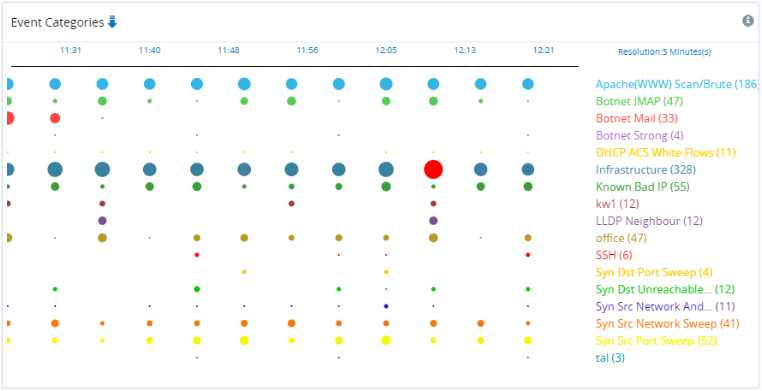
The Profiling Event Dashboard at Profiling > Profiling Events gives an overview of profile events.
At the top of the page you can set both the reporting period and resolution, from one minute to 4 weeks.
The Profiles infographic shows a timeline of the number of events with the profile(s) involved. Circle diameters represent the number of events. The peak number of events in the timeline for each profile are highlighted in red.
The Severities infographic shows a timeline of the number of events along with their estimated severity level(s). Circle diameters represent the number of events. The peak number of events in the timeline for each severity level are highlighted in red.
The Event Entries table gives a breakdown of profile events with the following entries:
- The unique event ID number.
- The time at which event occurred.
- The category or profile name.
- The severity of the event as a percentage.
- The source IP address.
- The target IP address.
- The application, user defined if it exists. See also Configuration > Profiling and Flow Details.
- Any information other error/status message, e.g. Profiler Exception.
A drop-down selector lets you choose the number of the most events to display.
To access a detailed overview of any flow, click on the adjacent Drill Down icon . This provides a complete overview of that flow, listing:
- The source address, a link to search forensics and any associated blacklists.
- Source MAC address.
- Destination address, a link to search forensics and any associated blacklists.
- Destination MAC address.
- Source port.
- Destination port.
- Appid: the application ID is a unique identifier for each application.
In GigaFlow, Appid is a positive or negative integer value. The way in which the Appid is generated depends on which of the 3 ways the application is defined within the system. Following the hierarchy outlined in Configuration > Profiling -- Apps/Options -- Defined Applications, a negative unique integer value is assigned if (1) the application is associated with a Profile Object or (2) if it is named in the system. If the application is given by its port number only (3), a unique positive integer value is generated that is a function of the lowest port number and the IP protocol.
- Application. See Appid, above, and Configuration > Profiling.
- Number of packets in flow.
- Number of bytes.
- User.
- Domain.
- Fwevent. See
- Fwextcode.
- Profile, e.g. PCs.
- Net device IP address, name and number of flows.
- In-Interface.
- Out-Interface.
See Glossary for more about flow record fields used by GigaFlow.
See also Search for instructions to access the Graphical Flow Mapping feature.
By clicking any Category, Severity, Source IP or Target IP in the Event Entries table, you will be taken to a version of the Events Dashboard filtered for that item.
See Dashboards > Events for an overview of the structure of this page.
An integration allows you to call defined external web pages or scripts directly from the Device Interface Overview page. To add an integration, navigate to System > Global. In the Integrations settings box, you can add or change an integration.
There are two types of integration:
- Device: where you can pass the device IP address.
- Interface: where you can pass the device IP address and the ifIndex of the interface being used.
To add an integration:
- Enter a new name, e.g. "Interface Action 1".
- Select the type of target, i.e. a device or an interface. These map to the IP address of the device and the ifIndex of the interface.
- Select the type of action, i.e. will the integration work with a web page or a script.
- Enter the web page URL or select a script.
- Enter inputs to be passed via the website or script.
- Click Save
 to save changes.
Example 1
In the code below, the populated field tells the software that you want to populate the device field with the IP address and the ifindex field with the ifindex. These fields (device and ifindex) will be passed to the target. We also have required fields, which are fields which the user is required to populate.
{ 'populated':{ 'device':'flow_device', 'ifindex':'flow_ifindex'},'required':[ {'name':'user','display':,'type':'text','value':}, {'name':'password','display':'Password','type':'password'}, {'name':'macro','display':'What Macro?','type':'select','data':['macro1','macro2','macro3','macro4']}]} Example 2:
var ProcessBuilder = Java.type('java.lang.ProcessBuilder');var BufferedReader = Java.type('java.io.BufferedReader');var InputStreamReader= Java.type('java.io.InputStreamReader');output.append(data);output.append("Device IP:"+data.get("device")+"");output.append("IFIndex:"+data.get("ifindex")+""); try { // Use a ProcessBuilder //var pb = new ProcessBuilder("ls","-lrt","/"); //linux var pb = new ProcessBuilder("cmd.exe", "/C", "dir"); //windows output.append("Command Run"); var p = pb.start(); var is = p.getInputStream(); var br = new BufferedReader(new InputStreamReader(is)); var line = null; while ((line = br.readLine()) != null) { output.append(line+""); } var r = p.waitFor(); // Let the process finish. if (r == 0) { // No error // run cmd2. } output.append("All Done"); } catch ( e) { output.append(e.printStackTrace()); }log.warn("end")See System > Global in the Reference Manual for more.
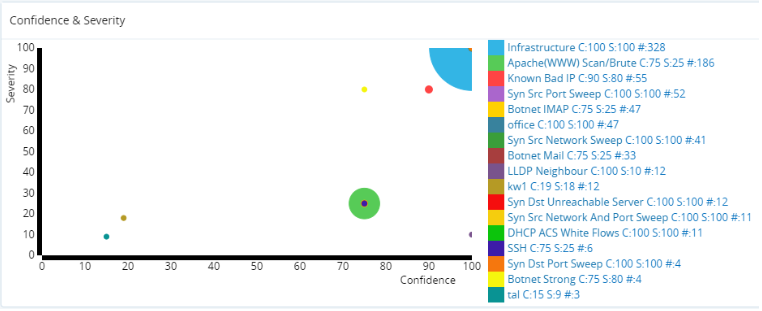 Confidence & Severity Infographic.